EX-99.3
Published on February 22, 2022
Exhibit 99.3

| TABLE OF CONTENTS | ||||||||||||||||||||||||||
| SECTION | PAGE | |||||||||||||||||||||||||
| Company Profile | ||||||||||||||||||||||||||
| Investor Information | ||||||||||||||||||||||||||
| Selected Financial Information | ||||||||||||||||||||||||||
| Selected Balance Sheet Information | ||||||||||||||||||||||||||
| Selected Operating Data | ||||||||||||||||||||||||||
| Funds From Operations and Funds From Operations as Adjusted | ||||||||||||||||||||||||||
| Adjusted Funds From Operations | ||||||||||||||||||||||||||
| Capital Structure | ||||||||||||||||||||||||||
| Summary of Ratios | ||||||||||||||||||||||||||
| Summary of Mortgage Notes Receivable | ||||||||||||||||||||||||||
| Investment Spending and Disposition Summaries | ||||||||||||||||||||||||||
| Property Under Development - Investment Spending Estimates | ||||||||||||||||||||||||||
| Portfolio Detail | ||||||||||||||||||||||||||
| Lease Expirations | ||||||||||||||||||||||||||
| Top Ten Customers by Total Revenue | ||||||||||||||||||||||||||
| Guidance | ||||||||||||||||||||||||||
| Definitions-Non-GAAP Financial Measures | ||||||||||||||||||||||||||
| Appendix-Reconciliation of Certain Non-GAAP Financial Measures | ||||||||||||||||||||||||||
 | ||||||||
| Q4 2021 Supplemental | Page 2 | |||||||
| CAUTIONARY STATEMENT CONCERNING FORWARD-LOOKING STATEMENTS | ||||||||||||||
The financial results in this document reflect preliminary, unaudited results, which are not final until the Company’s Annual Report on Form 10-K is filed. With the exception of historical information, certain statements contained or incorporated by reference herein may contain forward-looking statements within the meaning of Section 27A of the Securities Act of 1933, as amended (the “Securities Act”), and Section 21E of the Securities Exchange Act of 1934, as amended (the “Exchange Act”), such as those pertaining to the uncertain financial impact of the COVID-19 pandemic, our guidance, our capital resources and liquidity, our expected pursuit of growth opportunities, our expected cash flows and liquidity, the performance of our customers, our expected cash collections and our results of operations and financial condition. The estimates presented herein are based on the Company's current expectations and, given the current economic uncertainty, there can be no assurances that the Company will be able to continue to comply with applicable covenants under its debt agreements, which could materially impact actual performance. Forward-looking statements involve numerous risks and uncertainties, and you should not rely on them as predictions of actual events. There is no assurance the events or circumstances reflected in the forward-looking statements will occur. You can identify forward-looking statements by use of words such as “will be,” “intend,” “continue,” “believe,” “may,” “expect,” “hope,” “anticipate,” “goal,” “forecast,” “pipeline,” “estimates,” “offers,” “plans,” “would” or other similar expressions or other comparable terms or discussions of strategy, plans or intentions contained or incorporated by reference herein. Forward-looking statements necessarily are dependent on assumptions, data or methods that may be incorrect or imprecise. These forward-looking statements represent our intentions, plans, expectations and beliefs and are subject to numerous assumptions, risks and uncertainties. Many of the factors that will determine these items are beyond our ability to control or predict. For further discussion of these factors see “Item 1A. Risk Factors” in our most recent Annual Report on Form 10-K and, to the extent applicable, our Quarterly Reports on Form 10-Q.
For these statements, we claim the protection of the safe harbor for forward-looking statements contained in the Private Securities Litigation Reform Act of 1995. You are cautioned not to place undue reliance on our forward-looking statements, which speak only as of the date hereof or the date of any document incorporated by reference herein. All subsequent written and oral forward-looking statements attributable to us or any person acting on our behalf are expressly qualified in their entirety by the cautionary statements contained or referred to in this section. Except as required by law, we do not undertake any obligation to release publicly any revisions to our forward-looking statements to reflect events or circumstances after the date hereof.
NON-GAAP INFORMATION
This document contains certain non-GAAP measures. These non-GAAP measures, as calculated by the Company, are not necessarily comparable to similarly titled measures reported by other companies. Additionally, these non-GAAP measures are not measurements of financial performance or liquidity under GAAP and should not be considered alternatives to the Company's other financial information determined under GAAP. See pages 24 through 26 for definitions of certain non-GAAP financial measures used in this document and the reconciliations of certain non-GAAP measures on pages 9 and 10 and in the Appendix on pages 27 through 31.
| ||||||||
| Q4 2021 Supplemental | Page 3 | |||||||
| COMPANY PROFILE | ||||||||||||||
| THE COMPANY | COMPANY STRATEGY | |||||||
| EPR Properties ("we," "us," "our," "EPR" or the "Company") is a self-administered and self-managed real estate investment trust. EPR was formed in August 1997 as a Maryland real estate investment trust ("REIT"), and an initial public offering was completed on November 18, 1997. | Our primary business objective is to enhance shareholder value by achieving predictable growth in Funds from Operations As Adjusted ("FFOAA") and dividends per share. | |||||||
| Our strategic growth is focused on acquiring or developing a diversified portfolio of experiential real estate venues which create value by facilitating out of home congregate entertainment, recreation and leisure experiences where consumers choose to spend their discretionary time and money. This strategy is driven by the long-term trends of the growing experience economy. | ||||||||
| Since that time, the Company has been a leading Experiential net lease REIT, specializing in select enduring experiential properties. We are focused on growing our Experiential portfolio with properties that offer a variety of enduring, congregate entertainment, recreation and leisure activities. Separately, our Education portfolio is a legacy investment that provides additional geographic and operator diversity. | ||||||||
| This focus is consistent with our depth of knowledge across each of our property types, creating a competitive advantage that allows us to more quickly identify key market trends. We deliberately apply information and our ingenuity to target properties that represent logical extensions within each of our existing property types or potential future investments. | ||||||||
 | ||||||||
| As part of our strategic planning and portfolio management process we assess new opportunities against the following underwriting principles: | ||||||||
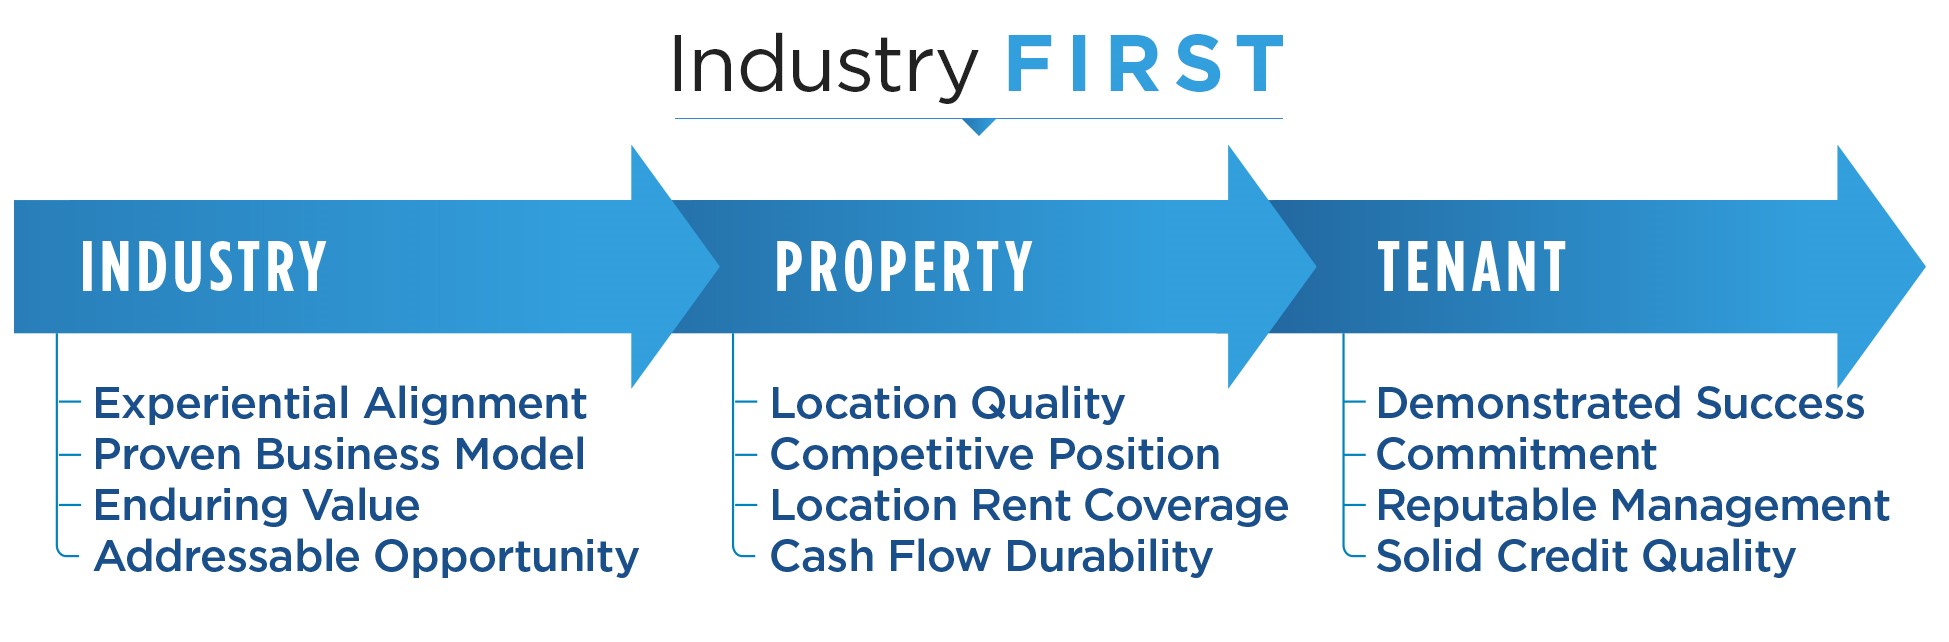 | ||||||||
| BUILDING THE PREMIER EXPERIENTIAL REAL ESTATE PORTFOLIO | ||||||||||||||||||||
 |  |  |  | |||||||||||||||||
| ||||||||
| Q4 2021 Supplemental | Page 4 | |||||||
| INVESTOR INFORMATION | ||||||||
| SENIOR MANAGEMENT | ||||||||
| Greg Silvers | Mark Peterson | |||||||
| President and Chief Executive Officer | Executive Vice President and Chief Financial Officer | |||||||
| Craig Evans | Greg Zimmerman | |||||||
| Executive Vice President, General Counsel and Secretary | Executive Vice President and Chief Investment Officer | |||||||
| Tonya Mater | Elizabeth Grace | |||||||
| Senior Vice President and Chief Accounting Officer | Senior Vice President - Human Resources and Administration | |||||||
| COMPANY INFORMATION | ||||||||
| CORPORATE HEADQUARTERS | TRADING SYMBOLS | |||||||
| 909 Walnut Street, Suite 200 | Common Stock: | |||||||
| Kansas City, MO 64106 | EPR | |||||||
| 888-EPR-REIT | Preferred Stock: | |||||||
| www.eprkc.com | EPR-PrC | |||||||
| EPR-PrE | ||||||||
| STOCK EXCHANGE LISTING | EPR-PrG | |||||||
| New York Stock Exchange | ||||||||
| EQUITY RESEARCH COVERAGE | ||||||||
| Bank of America Merrill Lynch | Jeffrey Spector/Joshua Dennerlein | 646-855-1363 | ||||||
| Citi Global Markets | Michael Bilerman/Katy McConnell | 212-816-4471 | ||||||
| Janney Montgomery Scott | Rob Stevenson | 646-840-3217 | ||||||
| J.P. Morgan | Anthony Paolone/Nikita Bely | 212-622-6682 | ||||||
| Kansas City Capital Associates | Jonathan Braatz | 816-932-8019 | ||||||
| Keybanc Capital Markets | Jordan Sadler/Todd Thomas | 917-368-2286 | ||||||
| Ladenburg Thalmann | John Massocca | 212-409-2056 | ||||||
| Raymond James & Associates | RJ Milligan | 727-567-2585 | ||||||
| RBC Capital Markets | Michael Carroll | 440-715-2649 | ||||||
| Stifel | Simon Yarmak | 443-224-1345 | ||||||
| Truist | Ki Bin Kim | 212-303-4124 | ||||||
EPR Properties is followed by the analysts identified above. Please note that any opinions, estimates, forecasts or recommendations regarding EPR Properties’ performance made by these analysts are theirs alone and do not represent opinions, estimates, forecasts or recommendations of EPR Properties or its management. EPR Properties does not by its reference above or distribution imply its endorsement of or concurrence with such information, conclusions or recommendations.
| ||||||||
| Q4 2021 Supplemental | Page 5 | |||||||
| SELECTED FINANCIAL INFORMATION | |||||||||||||||||||||||
| (UNAUDITED, DOLLARS AND SHARES IN THOUSANDS) | |||||||||||||||||||||||
| THREE MONTHS ENDED DECEMBER 31, | YEAR ENDED DECEMBER 31, | ||||||||||||||||||||||
| Operating Information: | 2021 | 2020 | 2021 | 2020 | |||||||||||||||||||
| Revenue | $ | 154,906 | $ | 93,412 | $ | 531,680 | $ | 414,661 | |||||||||||||||
| Net income (loss) available to common shareholders of EPR Properties | 38,523 | (26,011) | 74,472 | (155,864) | |||||||||||||||||||
| EBITDAre (1) | 126,046 | 40,277 | 429,450 | 243,019 | |||||||||||||||||||
| Adjusted EBITDAre (1) | 122,660 | 68,633 | 409,699 | 347,381 | |||||||||||||||||||
| Interest expense, net | 34,005 | 42,838 | 148,095 | 157,675 | |||||||||||||||||||
| Capitalized interest | 225 | 404 | 1,567 | 1,233 | |||||||||||||||||||
| Straight-lined rental revenue | 1,974 | 898 | 5,664 | (24,550) | |||||||||||||||||||
| Dividends declared on preferred shares | 6,034 | 6,034 | 24,134 | 24,136 | |||||||||||||||||||
| Dividends declared on common shares | 56,105 | — | 112,209 | 119,058 | |||||||||||||||||||
| General and administrative expense | 10,496 | 11,142 | 44,362 | 42,596 | |||||||||||||||||||
| DECEMBER 31, | |||||||||||||||||||||||
| Balance Sheet Information: | 2021 | 2020 | |||||||||||||||||||||
| Total assets | $ | 5,801,150 | $ | 6,704,185 | |||||||||||||||||||
| Accumulated depreciation | 1,167,734 | 1,062,087 | |||||||||||||||||||||
| Cash and cash equivalents | 288,822 | 1,025,577 | |||||||||||||||||||||
| Total assets before accumulated depreciation less cash and cash equivalents (gross assets) | 6,680,062 | 6,740,695 | |||||||||||||||||||||
| Debt | 2,804,365 | 3,694,443 | |||||||||||||||||||||
| Deferred financing costs, net | 36,864 | 35,552 | |||||||||||||||||||||
| Net debt (1) | 2,552,407 | 2,704,418 | |||||||||||||||||||||
| Equity | 2,618,039 | 2,630,585 | |||||||||||||||||||||
| Common shares outstanding | 74,808 | 74,603 | |||||||||||||||||||||
| Total market capitalization (using EOP closing price) | 6,476,062 | 5,500,044 | |||||||||||||||||||||
| Net debt/gross assets ratio (1) | 38 | % | 40 | % | |||||||||||||||||||
| Net debt/Adjusted EBITDAre ratio (1) (2) | 5.2 | Footnote 3 | |||||||||||||||||||||
| (1) See pages 24 through 26 for definitions. See calculation as applicable on page 30. | |||||||||||||||||||||||
| (2) Adjusted EBITDAre in this calculation is for the three month period multiplied times four. See pages 24 through 26 for definitions. See calculation on page 30. | |||||||||||||||||||||||
| (3) Not presented as this ratio is not meaningful given the disruption caused by COVID-19 and the associated accounting for tenant rent deferrals and other lease modifications. | |||||||||||||||||||||||
| ||||||||
| Q4 2021 Supplemental | Page 6 | |||||||
| SELECTED BALANCE SHEET INFORMATION | ||||||||||||||||||||||||||||||||||||||
| (UNAUDITED, DOLLARS IN THOUSANDS) | ||||||||||||||||||||||||||||||||||||||
| ASSETS | 4TH QUARTER 2021 | 3RD QUARTER 2021 | 2ND QUARTER 2021 | 1ST QUARTER 2021 | 4TH QUARTER 2020 | 3RD QUARTER 2020 | ||||||||||||||||||||||||||||||||
| Real estate investments | $ | 5,880,825 | $ | 5,943,074 | $ | 5,965,061 | $ | 5,902,833 | $ | 5,913,389 | $ | 6,139,858 | ||||||||||||||||||||||||||
| Less: accumulated depreciation | (1,167,734) | (1,142,513) | (1,130,409) | (1,101,727) | (1,062,087) | (1,072,201) | ||||||||||||||||||||||||||||||||
| Land held for development | 20,168 | 21,875 | 23,225 | 23,225 | 23,225 | 25,846 | ||||||||||||||||||||||||||||||||
| Property under development | 42,362 | 20,166 | 35,082 | 94,822 | 57,630 | 44,103 | ||||||||||||||||||||||||||||||||
| Operating lease right-of-use assets | 180,808 | 175,987 | 179,354 | 179,113 | 163,766 | 185,459 | ||||||||||||||||||||||||||||||||
| Mortgage notes and related accrued interest receivable | 370,159 | 369,134 | 366,064 | 364,969 | 365,628 | 362,011 | ||||||||||||||||||||||||||||||||
| Investment in joint ventures | 36,670 | 38,729 | 27,476 | 28,313 | 28,208 | 29,571 | ||||||||||||||||||||||||||||||||
| Cash and cash equivalents | 288,822 | 144,433 | 509,836 | 538,077 | 1,025,577 | 985,372 | ||||||||||||||||||||||||||||||||
| Restricted cash | 1,079 | 5,142 | 3,570 | 5,928 | 2,433 | 2,424 | ||||||||||||||||||||||||||||||||
| Accounts receivable | 78,073 | 80,491 | 91,319 | 97,517 | 116,193 | 129,714 | ||||||||||||||||||||||||||||||||
| Other assets | 69,918 | 64,639 | 71,634 | 75,032 | 70,223 | 75,053 | ||||||||||||||||||||||||||||||||
| Total assets | $ | 5,801,150 | $ | 5,721,157 | $ | 6,142,212 | $ | 6,208,102 | $ | 6,704,185 | $ | 6,907,210 | ||||||||||||||||||||||||||
| LIABILITIES AND EQUITY | ||||||||||||||||||||||||||||||||||||||
| Liabilities: | ||||||||||||||||||||||||||||||||||||||
Accounts payable and accrued liabilities | $ | 73,462 | $ | 87,021 | $ | 103,778 | $ | 95,085 | $ | 105,379 | $ | 95,429 | ||||||||||||||||||||||||||
Operating lease liabilities | 218,795 | 214,065 | 217,575 | 217,448 | 202,223 | 225,379 | ||||||||||||||||||||||||||||||||
Common dividends payable | 18,896 | 18,802 | 54 | 44 | 36 | 29 | ||||||||||||||||||||||||||||||||
Preferred dividends payable | 6,034 | 6,033 | 6,033 | 6,034 | 6,034 | 6,034 | ||||||||||||||||||||||||||||||||
Unearned rents and interest | 61,559 | 79,692 | 79,992 | 83,565 | 65,485 | 75,415 | ||||||||||||||||||||||||||||||||
Line of credit | — | — | — | 90,000 | 590,000 | 750,000 | ||||||||||||||||||||||||||||||||
Deferred financing costs, net | (36,864) | (32,166) | (34,744) | (35,036) | (35,552) | (35,140) | ||||||||||||||||||||||||||||||||
Other debt | 2,841,229 | 2,716,229 | 3,116,229 | 3,116,229 | 3,139,995 | 3,139,995 | ||||||||||||||||||||||||||||||||
| Total liabilities | 3,183,111 | 3,089,676 | 3,488,917 | 3,573,369 | 4,073,600 | 4,257,141 | ||||||||||||||||||||||||||||||||
| Equity: | ||||||||||||||||||||||||||||||||||||||
Common stock and additional paid-in-capital | 3,877,639 | 3,873,599 | 3,869,687 | 3,865,243 | 3,858,451 | 3,853,581 | ||||||||||||||||||||||||||||||||
Preferred stock at par value | 148 | 148 | 148 | 148 | 148 | 148 | ||||||||||||||||||||||||||||||||
Treasury stock | (264,817) | (264,679) | (264,660) | (263,982) | (261,238) | (260,594) | ||||||||||||||||||||||||||||||||
| Accumulated other comprehensive income (loss) | 9,955 | 9,625 | 5,265 | 2,978 | 216 | (2,106) | ||||||||||||||||||||||||||||||||
Distributions in excess of net income | (1,004,886) | (987,212) | (957,145) | (969,654) | (966,992) | (940,960) | ||||||||||||||||||||||||||||||||
| Total equity | 2,618,039 | 2,631,481 | 2,653,295 | 2,634,733 | 2,630,585 | 2,650,069 | ||||||||||||||||||||||||||||||||
| Total liabilities and equity | $ | 5,801,150 | $ | 5,721,157 | $ | 6,142,212 | $ | 6,208,102 | $ | 6,704,185 | $ | 6,907,210 | ||||||||||||||||||||||||||
| ||||||||
| Q4 2021 Supplemental | Page 7 | |||||||
| SELECTED OPERATING DATA | |||||||||||||||||||||||||||||||||||
| (UNAUDITED, DOLLARS IN THOUSANDS) | |||||||||||||||||||||||||||||||||||
| 4TH QUARTER 2021 | 3RD QUARTER 2021 | 2ND QUARTER 2021 | 1ST QUARTER 2021 | 4TH QUARTER 2020 | 3RD QUARTER 2020 | ||||||||||||||||||||||||||||||
| Rental revenue | $ | 137,345 | $ | 123,040 | $ | 115,883 | $ | 102,614 | $ | 84,011 | $ | 55,591 | |||||||||||||||||||||||
| Other income | 9,014 | 8,091 | 1,033 | 678 | 968 | 182 | |||||||||||||||||||||||||||||
| Mortgage and other financing income | 8,547 | 8,516 | 8,446 | 8,473 | 8,433 | 8,104 | |||||||||||||||||||||||||||||
| Total revenue | 154,906 | 139,647 | 125,362 | 111,765 | 93,412 | 63,877 | |||||||||||||||||||||||||||||
| Property operating expense | 12,933 | 13,815 | 14,678 | 15,313 | 16,406 | 13,759 | |||||||||||||||||||||||||||||
| Other expense | 8,313 | 7,851 | 3,025 | 2,552 | 1,462 | 2,680 | |||||||||||||||||||||||||||||
| General and administrative expense | 10,496 | 11,154 | 11,376 | 11,336 | 11,142 | 10,034 | |||||||||||||||||||||||||||||
Severance expense | — | — | — | — | 2,868 | — | |||||||||||||||||||||||||||||
Costs associated with loan refinancing or payoff | 20,469 | 4,741 | — | 241 | 812 | — | |||||||||||||||||||||||||||||
| Interest expense, net | 34,005 | 36,584 | 38,312 | 39,194 | 42,838 | 41,744 | |||||||||||||||||||||||||||||
| Transaction costs | 60 | 2,132 | 662 | 548 | 814 | 2,776 | |||||||||||||||||||||||||||||
| Credit loss (benefit) expense | (2,295) | (14,096) | (2,819) | (2,762) | 20,312 | 5,707 | |||||||||||||||||||||||||||||
| Impairment charges | — | 2,711 | — | — | 22,832 | 11,561 | |||||||||||||||||||||||||||||
| Depreciation and amortization | 40,294 | 42,612 | 40,538 | 40,326 | 42,014 | 42,059 | |||||||||||||||||||||||||||||
| Income (loss) before equity in loss from joint ventures and other items | 30,631 | 32,143 | 19,590 | 5,017 | (68,088) | (66,443) | |||||||||||||||||||||||||||||
| Equity in loss from joint ventures | (2,059) | (418) | (1,151) | (1,431) | (1,364) | (1,044) | |||||||||||||||||||||||||||||
| Gain on sale of real estate | 16,382 | 787 | 511 | 201 | 49,877 | — | |||||||||||||||||||||||||||||
| Income tax expense | (397) | (395) | (398) | (407) | (402) | (18,417) | |||||||||||||||||||||||||||||
| Net income (loss) | 44,557 | 32,117 | 18,552 | 3,380 | (19,977) | (85,904) | |||||||||||||||||||||||||||||
| Preferred dividend requirements | (6,034) | (6,033) | (6,033) | (6,034) | (6,034) | (6,034) | |||||||||||||||||||||||||||||
| Net income (loss) available to common shareholders of EPR Properties | $ | 38,523 | $ | 26,084 | $ | 12,519 | $ | (2,654) | $ | (26,011) | $ | (91,938) | |||||||||||||||||||||||
| ||||||||
| Q4 2021 Supplemental | Page 8 | |||||||
| FUNDS FROM OPERATIONS AND FUNDS FROM OPERATIONS AS ADJUSTED | ||||||||||||||||||||||||||||||||||||||
| (UNAUDITED, DOLLARS IN THOUSANDS EXCEPT PER SHARE INFORMATION) | ||||||||||||||||||||||||||||||||||||||
| FUNDS FROM OPERATIONS ("FFO") (1): | 4TH QUARTER 2021 | 3RD QUARTER 2021 | 2ND QUARTER 2021 | 1ST QUARTER 2021 | 4TH QUARTER 2020 | 3RD QUARTER 2020 | ||||||||||||||||||||||||||||||||
| Net income (loss) available to common shareholders of EPR Properties | $ | 38,523 | $ | 26,084 | $ | 12,519 | $ | (2,654) | $ | (26,011) | $ | (91,938) | ||||||||||||||||||||||||||
| Gain on sale of real estate | (16,382) | (787) | (511) | (201) | (49,877) | — | ||||||||||||||||||||||||||||||||
| Impairment of real estate investments, net | — | 2,711 | — | — | 22,832 | 11,561 | ||||||||||||||||||||||||||||||||
| Real estate depreciation and amortization | 40,095 | 42,415 | 40,332 | 40,109 | 41,786 | 41,791 | ||||||||||||||||||||||||||||||||
| Allocated share of joint venture depreciation | 1,561 | 966 | 459 | 354 | 361 | 369 | ||||||||||||||||||||||||||||||||
| FFO available to common shareholders of EPR Properties | $ | 63,797 | $ | 71,389 | $ | 52,799 | $ | 37,608 | $ | (10,909) | $ | (38,217) | ||||||||||||||||||||||||||
| FUNDS FROM OPERATIONS AS ADJUSTED ("FFOAA") (1): | ||||||||||||||||||||||||||||||||||||||
| FFO available to common shareholders of EPR Properties | $ | 63,797 | $ | 71,389 | $ | 52,799 | $ | 37,608 | $ | (10,909) | $ | (38,217) | ||||||||||||||||||||||||||
| Costs associated with loan refinancing or payoff | 20,469 | 4,741 | — | 241 | 812 | — | ||||||||||||||||||||||||||||||||
| Transaction costs | 60 | 2,132 | 662 | 548 | 814 | 2,776 | ||||||||||||||||||||||||||||||||
| Severance expense | — | — | — | — | 2,868 | — | ||||||||||||||||||||||||||||||||
| Gain on insurance recovery (included in other income) | (1,151) | — | — | (30) | (809) | — | ||||||||||||||||||||||||||||||||
| Credit loss (benefit) expense | (2,295) | (14,096) | (2,819) | (2,762) | 20,312 | 5,707 | ||||||||||||||||||||||||||||||||
| Deferred income tax expense | — | — | — | — | — | 18,035 | ||||||||||||||||||||||||||||||||
| FFO as adjusted available to common shareholders of EPR Properties | $ | 80,880 | $ | 64,166 | $ | 50,642 | $ | 35,605 | $ | 13,088 | $ | (11,699) | ||||||||||||||||||||||||||
| FFO as adjusted available to common shareholders of EPR Properties | $ | 80,880 | $ | 64,166 | $ | 50,642 | $ | 35,605 | $ | 13,088 | $ | (11,699) | ||||||||||||||||||||||||||
| Add: Preferred dividends for Series C preferred shares | 1,938 | — | — | — | — | — | ||||||||||||||||||||||||||||||||
| Add: Preferred dividends for Series E preferred shares | 1,939 | — | — | — | — | — | ||||||||||||||||||||||||||||||||
| Diluted FFO as adjusted available to common shareholders of EPR Properties | $ | 84,757 | $ | 64,166 | $ | 50,642 | $ | 35,605 | $ | 13,088 | $ | (11,699) | ||||||||||||||||||||||||||
| FFO per common share: | ||||||||||||||||||||||||||||||||||||||
| Basic | $ | 0.85 | $ | 0.95 | $ | 0.71 | $ | 0.50 | $ | (0.15) | $ | (0.51) | ||||||||||||||||||||||||||
| Diluted | 0.85 | 0.95 | 0.71 | 0.50 | (0.15) | (0.51) | ||||||||||||||||||||||||||||||||
| FFO as adjusted per common share: | ||||||||||||||||||||||||||||||||||||||
| Basic | $ | 1.08 | $ | 0.86 | $ | 0.68 | $ | 0.48 | $ | 0.18 | $ | (0.16) | ||||||||||||||||||||||||||
| Diluted | 1.08 | 0.86 | 0.68 | 0.48 | 0.18 | (0.16) | ||||||||||||||||||||||||||||||||
| Shares used for computation (in thousands): | ||||||||||||||||||||||||||||||||||||||
| Basic | 74,806 | 74,804 | 74,781 | 74,627 | 74,615 | 74,613 | ||||||||||||||||||||||||||||||||
| Diluted | 74,808 | 74,911 | 74,870 | 74,669 | 74,615 | 74,613 | ||||||||||||||||||||||||||||||||
| Effect of dilutive Series C preferred shares | 2,237 | — | — | — | — | — | ||||||||||||||||||||||||||||||||
| Effect of dilutive Series E preferred shares | 1,664 | — | — | — | — | — | ||||||||||||||||||||||||||||||||
| Adjusted weighted-average shares outstanding-diluted Series C and Series E | 78,709 | 74,911 | 74,870 | 74,669 | 74,615 | 74,613 | ||||||||||||||||||||||||||||||||
| (1) See pages 24 through 26 for definitions. | ||||||||||||||||||||||||||||||||||||||
| ||||||||
| Q4 2021 Supplemental | Page 9 | |||||||
| ADJUSTED FUNDS FROM OPERATIONS | ||||||||||||||||||||||||||||||||||||||
| (UNAUDITED, DOLLARS IN THOUSANDS EXCEPT PER SHARE INFORMATION) | ||||||||||||||||||||||||||||||||||||||
| ADJUSTED FUNDS FROM OPERATIONS ("AFFO") (1): | 4TH QUARTER 2021 | 3RD QUARTER 2021 | 2ND QUARTER 2021 | 1ST QUARTER 2021 | 4TH QUARTER 2020 | 3RD QUARTER 2020 | ||||||||||||||||||||||||||||||||
FFO available to common shareholders of EPR Properties | $ | 63,797 | $ | 71,389 | $ | 52,799 | $ | 37,608 | $ | (10,909) | $ | (38,217) | ||||||||||||||||||||||||||
| Adjustments: | ||||||||||||||||||||||||||||||||||||||
Costs associated with loan refinancing or payoff | 20,469 | 4,741 | — | 241 | 812 | — | ||||||||||||||||||||||||||||||||
| Transaction costs | 60 | 2,132 | 662 | 548 | 814 | 2,776 | ||||||||||||||||||||||||||||||||
| Credit loss (benefit) expense | (2,295) | (14,096) | (2,819) | (2,762) | 20,312 | 5,707 | ||||||||||||||||||||||||||||||||
| Severance expense | — | — | — | — | 2,868 | — | ||||||||||||||||||||||||||||||||
| Gain on insurance recovery (included in other income) | (1,151) | — | — | (30) | (809) | — | ||||||||||||||||||||||||||||||||
| Deferred income tax expense | — | — | — | — | — | 18,035 | ||||||||||||||||||||||||||||||||
| Non-real estate depreciation and amortization | 199 | 197 | 206 | 217 | 228 | 268 | ||||||||||||||||||||||||||||||||
| Deferred financing fees amortization | 2,335 | 2,210 | 1,574 | 1,547 | 1,823 | 1,498 | ||||||||||||||||||||||||||||||||
Share-based compensation expense to management and trustees | 3,685 | 3,759 | 3,675 | 3,784 | 3,437 | 3,410 | ||||||||||||||||||||||||||||||||
| Amortization of above/below market leases, net and tenant allowances | (92) | (98) | (99) | (96) | (96) | (124) | ||||||||||||||||||||||||||||||||
| Maintenance capital expenditures (2) | (1,718) | (690) | (1,467) | (756) | (247) | (8,911) | ||||||||||||||||||||||||||||||||
| Straight-lined rental revenue | (1,974) | (981) | (1,420) | (1,289) | (898) | 17,969 | ||||||||||||||||||||||||||||||||
| Straight-lined ground sublease expense | 89 | 98 | 111 | 84 | 150 | 216 | ||||||||||||||||||||||||||||||||
Non-cash portion of mortgage and other financing income | (114) | 55 | (216) | (171) | (133) | 71 | ||||||||||||||||||||||||||||||||
| AFFO available to common shareholders of EPR Properties | $ | 83,290 | $ | 68,716 | $ | 53,006 | $ | 38,925 | $ | 17,352 | $ | 2,698 | ||||||||||||||||||||||||||
| AFFO available to common shareholders of EPR Properties | $ | 83,290 | $ | 68,716 | $ | 53,006 | $ | 38,925 | $ | 17,352 | $ | 2,698 | ||||||||||||||||||||||||||
| Add: Preferred dividends for Series C preferred shares | 1,938 | — | — | — | — | — | ||||||||||||||||||||||||||||||||
| Add: Preferred dividends for Series E preferred shares | 1,939 | — | — | — | — | — | ||||||||||||||||||||||||||||||||
| Diluted AFFO available to common shareholders of EPR Properties | $ | 87,167 | $ | 68,716 | $ | 53,006 | $ | 38,925 | $ | 17,352 | $ | 2,698 | ||||||||||||||||||||||||||
Weighted average diluted shares outstanding (in thousands) | 74,808 | 74,911 | 74,870 | 74,669 | 74,615 | 74,613 | ||||||||||||||||||||||||||||||||
| Effect of dilutive Series C preferred shares | 2,237 | — | — | — | — | — | ||||||||||||||||||||||||||||||||
| Effect of dilutive Series E preferred shares | 1,664 | — | — | — | — | — | ||||||||||||||||||||||||||||||||
| Adjusted weighted-average shares outstanding-diluted | 78,709 | 74,911 | 74,870 | 74,669 | 74,615 | 74,613 | ||||||||||||||||||||||||||||||||
| AFFO per diluted common share | $ | 1.11 | $ | 0.92 | $ | 0.71 | $ | 0.52 | $ | 0.23 | $ | 0.04 | ||||||||||||||||||||||||||
| Dividends declared per common share | $ | 0.750 | $ | 0.750 | $ | — | $ | — | $ | — | $ | — | ||||||||||||||||||||||||||
| AFFO payout ratio (3) | 68 | % | 82 | % | — | % | — | % | — | % | — | % | ||||||||||||||||||||||||||
| (1) See pages 24 through 26 for definitions. | ||||||||||||||||||||||||||||||||||||||
| (2) Includes maintenance capital expenditures and certain second generation tenant improvements and leasing commissions. | ||||||||||||||||||||||||||||||||||||||
| (3) AFFO payout ratio is calculated by dividing dividends declared per common share by AFFO per diluted common share. The monthly cash dividend to common shareholders was temporarily suspended following the common share dividend paid on May 15, 2020 to shareholders of record as of April 30, 2020. On July 13, 2021, following termination of the Covenant Relief Period, the Company resumed regular monthly cash dividends to common shareholders. During both the three months ended September 30, 2021 and December 31, 2021, the Company declared cash dividends totaling $0.75 per common share. | ||||||||||||||||||||||||||||||||||||||
| ||||||||
| Q4 2021 Supplemental | Page 10 | |||||||
| CAPITAL STRUCTURE AS OF DECEMBER 31, 2021 | ||||||||||||||||||||||||||||||||
| (UNAUDITED, DOLLARS IN THOUSANDS) | ||||||||||||||||||||||||||||||||
| CONSOLIDATED DEBT | ||||||||||||||||||||||||||||||||
| PRINCIPAL PAYMENTS DUE ON DEBT: | ||||||||||||||||||||||||||||||||
| BONDS/TERM LOAN/OTHER (1) | UNSECURED CREDIT FACILITY (2) | UNSECURED SENIOR NOTES | TOTAL | WEIGHTED AVG INTEREST RATE | ||||||||||||||||||||||||||||
| YEAR | ||||||||||||||||||||||||||||||||
| 2022 | $ | — | $ | — | $ | — | $ | — | —% | |||||||||||||||||||||||
| 2023 | — | — | — | — | —% | |||||||||||||||||||||||||||
| 2024 | — | — | 136,637 | 136,637 | 4.35% | |||||||||||||||||||||||||||
| 2025 | — | — | 300,000 | 300,000 | 4.50% | |||||||||||||||||||||||||||
| 2026 | — | — | 629,597 | 629,597 | 4.70% | |||||||||||||||||||||||||||
| 2027 | — | — | 450,000 | 450,000 | 4.50% | |||||||||||||||||||||||||||
| 2028 | — | — | 400,000 | 400,000 | 4.95% | |||||||||||||||||||||||||||
| 2029 | — | — | 500,000 | 500,000 | 3.75% | |||||||||||||||||||||||||||
| 2030 | — | — | — | — | —% | |||||||||||||||||||||||||||
| 2031 | — | — | 400,000 | (2) | 400,000 | 3.60% | ||||||||||||||||||||||||||
| 2032 | — | — | — | — | —% | |||||||||||||||||||||||||||
| Thereafter | 24,995 | — | — | 24,995 | 1.39% | |||||||||||||||||||||||||||
| Less: deferred financing costs, net | — | — | — | (36,864) | —% | |||||||||||||||||||||||||||
| $ | 24,995 | $ | — | $ | 2,816,234 | $ | 2,804,365 | 4.31% | ||||||||||||||||||||||||
| BALANCE | WEIGHTED AVG INTEREST RATE | WEIGHTED AVG MATURITY | ||||||||||||||||||||||||||||||
| Fixed rate unsecured debt | $ | 2,816,234 | 4.34 | % | 6.02 | |||||||||||||||||||||||||||
| Fixed rate secured debt (1) | 24,995 | 1.39 | % | 25.58 | ||||||||||||||||||||||||||||
| Less: deferred financing costs, net | (36,864) | — | % | — | ||||||||||||||||||||||||||||
| Total | $ | 2,804,365 | 4.31 | % | 6.25 | |||||||||||||||||||||||||||
| (1) Includes $25 million of secured bonds that have been fixed through interest rate swaps through September 30, 2024. | ||||||||||||||||||||||||||||||||
| (2) Unsecured Revolving Credit Facility Summary: | ||||||||||||||||||||||||||||||||
| BALANCE | RATE | |||||||||||||||||||||||||||||||
| COMMITMENT | AT 12/31/2021 | MATURITY | AT 12/31/2021 | |||||||||||||||||||||||||||||
| $1,000,000 | $— | October 6, 2025 | 1.301% | |||||||||||||||||||||||||||||
Note: On October 6, 2021, the Company amended and restated its Consolidated Credit Agreement. The new facility no longer includes a $400.0 million term loan facility, which was paid off on September 13, 2021. The new facility will mature on October 6, 2025 and has two six-month extensions available at the Company's option and includes an accordion feature pursuant to which the maximum borrowing amount can be increased from $1.0 billion to $2.0 billion, in each case, subject to certain terms and conditions. The new facility has the same pricing terms and financial covenants as the prior facility. | ||||||||||||||||||||||||||||||||
| ||||||||
| Q4 2021 Supplemental | Page 11 | |||||||
| CAPITAL STRUCTURE AS OF DECEMBER 31, 2021 AND 2020 | ||||||||||||||
| (UNAUDITED, DOLLARS IN THOUSANDS) | ||||||||||||||
| CONSOLIDATED DEBT (continued) | ||||||||||||||
| SUMMARY OF DEBT: | December 31, 2021 | December 31, 2020 | ||||||||||||
| Unsecured term loan payable, paid in full and related interest rate swaps terminated on September 13, 2021 | $ | — | $ | 400,000 | ||||||||||
| Senior unsecured notes payable, 5.25%, paid in full November 12, 2021 | — | 275,000 | ||||||||||||
| Senior unsecured notes payable, 4.35% at December 31, 2021, due August 22, 2024 | 136,637 | 148,000 | ||||||||||||
| Senior unsecured notes payable, 4.50%, due April 1, 2025 | 300,000 | 300,000 | ||||||||||||
| Unsecured revolving variable rate credit facility, LIBOR + 1.20%, due October 6, 2025 | — | 590,000 | ||||||||||||
| Senior unsecured notes payable, 4.56% at December 31, 2021, due August 22, 2026 | 179,597 | 192,000 | ||||||||||||
| Senior unsecured notes payable, 4.75%, due December 15, 2026 | 450,000 | 450,000 | ||||||||||||
| Senior unsecured notes payable, 4.50%, due June 1, 2027 | 450,000 | 450,000 | ||||||||||||
| Senior unsecured notes payable, 4.95%, due April 15, 2028 | 400,000 | 400,000 | ||||||||||||
| Senior unsecured notes payable, 3.75%, due August 15, 2029 | 500,000 | 500,000 | ||||||||||||
| Senior unsecured notes payable, 3.60%, due November 15, 2031 | 400,000 | — | ||||||||||||
| Bonds payable, variable rate, fixed at 1.39% through September 30, 2024, due August 1, 2047 | 24,995 | 24,995 | ||||||||||||
| Less: deferred financing costs, net | (36,864) | (35,552) | ||||||||||||
| Total debt | $ | 2,804,365 | $ | 3,694,443 | ||||||||||
| ||||||||
| Q4 2021 Supplemental | Page 12 | |||||||
| CAPITAL STRUCTURE | |||||||||||||||||||||||
| SENIOR NOTES | |||||||||||||||||||||||
| SENIOR DEBT RATINGS AS OF DECEMBER 31, 2021 | |||||||||||||||||||||||
| Moody's | Baa3 (stable) | ||||||||||||||||||||||
| Fitch | BB+ (stable) | ||||||||||||||||||||||
| Standard and Poor's | BBB- (stable) | ||||||||||||||||||||||
| SUMMARY OF COVENANTS | |||||||||||||||||||||||
| The Company had outstanding public senior unsecured notes with fixed interest rates of 3.60%, 3.75%, 4.50%, 4.75% and 4.95% at December 31, 2021. Interest on these notes is paid semiannually. These public senior unsecured notes contain various covenants, including: (i) a limitation on incurrence of any debt that would cause the Company's debt to adjusted total assets ratio to exceed 60%; (ii) a limitation on incurrence of any secured debt which would cause the Company’s secured debt to adjusted total assets ratio to exceed 40%; (iii) a limitation on incurrence of any debt which would cause the Company’s debt service coverage ratio to be less than 1.5 times; and (iv) the maintenance at all times of total unencumbered assets not less than 150% of the Company’s outstanding unsecured debt. | |||||||||||||||||||||||
| The following is a summary of the key financial covenants for the Company's 3.60%, 3.75%, 4.50%, 4.75% and 4.95% public senior unsecured notes, as defined and calculated per the terms of the notes. These calculations, which are not based on U.S. generally accepted accounting principles, or GAAP, measurements, are presented to investors to show the Company's ability to incur additional debt under the terms of the senior unsecured notes only and are not measures of the Company's liquidity or performance. The actual amounts as of December 31, 2021 and September 30, 2021 are: | |||||||||||||||||||||||
| Actual | Actual | ||||||||||||||||||||||
| NOTE COVENANTS | Required | 4th Quarter 2021 (1) | 3rd Quarter 2021 (1) | ||||||||||||||||||||
| Limitation on incurrence of total debt (Total Debt/Total Assets) | ≤ 60% | 41% | 40% | ||||||||||||||||||||
| Limitation on incurrence of secured debt (Secured Debt/Total Assets) | ≤ 40% | —% | —% | ||||||||||||||||||||
| Limitation on incurrence of debt: Debt service coverage (Consolidated Income Available for Debt Service/Annual Debt Service) - trailing twelve months | ≥ 1.5 x | 2.8x | 2.3x | ||||||||||||||||||||
| Maintenance of total unencumbered assets (Unencumbered Assets/Unsecured Debt) | ≥ 150% of unsecured debt | 232% | 239% | ||||||||||||||||||||
| (1) See page 14 for details of calculations. | |||||||||||||||||||||||
| ||||||||
| Q4 2021 Supplemental | Page 13 | |||||||
| CAPITAL STRUCTURE | ||||||||||||||||||||||||||||||||
| SENIOR NOTES | ||||||||||||||||||||||||||||||||
| (UNAUDITED, DOLLARS IN THOUSANDS) | ||||||||||||||||||||||||||||||||
| COVENANT CALCULATIONS | ||||||||||||||||||||||||||||||||
| TOTAL ASSETS: | December 31, 2021 | TOTAL DEBT: | December 31, 2021 | |||||||||||||||||||||||||||||
| Total Assets per balance sheet | $ | 5,801,150 | Secured debt obligations | $ | 24,995 | |||||||||||||||||||||||||||
| Add: accumulated depreciation | 1,167,734 | Unsecured debt obligations: | ||||||||||||||||||||||||||||||
| Less: intangible assets, net | (37,799) | Unsecured debt | 2,816,234 | |||||||||||||||||||||||||||||
| Total Assets | $ | 6,931,085 | Outstanding letters of credit | — | ||||||||||||||||||||||||||||
| Guarantees | — | |||||||||||||||||||||||||||||||
| TOTAL UNENCUMBERED ASSETS: | December 31, 2021 | Derivatives at fair market value, net, if liability | 4,888 | |||||||||||||||||||||||||||||
| Unencumbered real estate assets, gross | $ | 6,188,395 | Total unsecured debt obligations: | 2,821,122 | ||||||||||||||||||||||||||||
| Cash and cash equivalents | 288,822 | Total Debt | $ | 2,846,117 | ||||||||||||||||||||||||||||
| Land held for development | 20,168 | |||||||||||||||||||||||||||||||
| Property under development | 42,362 | |||||||||||||||||||||||||||||||
| Total Unencumbered Assets | $ | 6,539,747 | ||||||||||||||||||||||||||||||
| CONSOLIDATED INCOME AVAILABLE FOR DEBT SERVICE: | 4TH QUARTER 2021 | 3RD QUARTER 2021 | 2ND QUARTER 2021 | 1ST QUARTER 2021 | TRAILING TWELVE MONTHS | |||||||||||||||||||||||||||
| Adjusted EBITDAre | $ | 122,660 | $ | 108,356 | $ | 96,437 | $ | 82,246 | $ | 409,699 | ||||||||||||||||||||||
| Less: straight-line rental revenue, net, included in adjusted EBITDAre | (1,974) | (981) | (1,420) | (1,289) | (5,664) | |||||||||||||||||||||||||||
| CONSOLIDATED INCOME AVAILABLE FOR DEBT SERVICE | $ | 120,686 | $ | 107,375 | $ | 95,017 | $ | 80,957 | $ | 404,035 | ||||||||||||||||||||||
| ANNUAL DEBT SERVICE: | ||||||||||||||||||||||||||||||||
| Interest expense, gross | $ | 34,251 | $ | 36,841 | $ | 38,869 | $ | 39,854 | $ | 149,815 | ||||||||||||||||||||||
| Less: deferred financing fees amortization | (2,335) | (2,210) | (1,574) | (1,547) | (7,666) | |||||||||||||||||||||||||||
| ANNUAL DEBT SERVICE | $ | 31,916 | $ | 34,631 | $ | 37,295 | $ | 38,307 | $ | 142,149 | ||||||||||||||||||||||
| DEBT SERVICE COVERAGE | 3.8 | 3.1 | 2.5 | 2.1 | 2.8 | |||||||||||||||||||||||||||
| ||||||||
| Q4 2021 Supplemental | Page 14 | |||||||
| CAPITAL STRUCTURE AS OF DECEMBER 31, 2021 | ||||||||||||||||||||||||||||||||||||||||||||
| (UNAUDITED, DOLLARS IN THOUSANDS EXCEPT SHARE INFORMATION) | ||||||||||||||||||||||||||||||||||||||||||||
| EQUITY | ||||||||||||||||||||||||||||||||||||||||||||
| SECURITY | SHARES OUTSTANDING | PRICE PER SHARE AT DECEMBER 31, 2021 | LIQUIDATION PREFERENCE | DIVIDEND RATE | CONVERTIBLE | CONVERSION RATIO AT DECEMBER 31, 2021 | CONVERSION PRICE AT DECEMBER 31, 2021 | |||||||||||||||||||||||||||||||||||||
| Common shares | 74,808,315 | $47.49 | N/A | (1) | N/A | N/A | N/A | |||||||||||||||||||||||||||||||||||||
| Series C | 5,392,916 | $25.58 | $134,823 | 5.750% | Y | 0.4148 | $60.27 | |||||||||||||||||||||||||||||||||||||
| Series E | 3,447,381 | $35.75 | $86,185 | 9.000% | Y | 0.4826 | $51.80 | |||||||||||||||||||||||||||||||||||||
| Series G | 6,000,000 | $25.26 | $150,000 | 5.750% | N | N/A | N/A | |||||||||||||||||||||||||||||||||||||
| (1) Total monthly dividends declared in the fourth quarter of 2021 were $0.75 per share. | ||||||||||||||||||||||||||||||||||||||||||||
| ||||||||
| Q4 2021 Supplemental | Page 15 | |||||||
| SUMMARY OF RATIOS | |||||||||||||||||||||||||||||||||||
| (UNAUDITED) | |||||||||||||||||||||||||||||||||||
| 4TH QUARTER 2021 | 3RD QUARTER 2021 | 2ND QUARTER 2021 | 1ST QUARTER 2021 | 4TH QUARTER 2020 | 3RD QUARTER 2020 | ||||||||||||||||||||||||||||||
| Net debt to gross assets ratio (1) | 38% | 38% | 39% | 39% | 40% | 42% | |||||||||||||||||||||||||||||
| Net debt/Adjusted EBITDAre ratio (1)(2) | 5.2 | Footnote 7 | Footnote 7 | Footnote 7 | Footnote 7 | Footnote 7 | |||||||||||||||||||||||||||||
| Interest coverage ratio (3) | 3.5 | Footnote 7 | Footnote 7 | Footnote 7 | Footnote 7 | Footnote 7 | |||||||||||||||||||||||||||||
| Fixed charge coverage ratio (3) | 3.0 | Footnote 7 | Footnote 7 | Footnote 7 | Footnote 7 | Footnote 7 | |||||||||||||||||||||||||||||
| Debt service coverage ratio (3) | 3.5 | Footnote 7 | Footnote 7 | Footnote 7 | Footnote 7 | Footnote 7 | |||||||||||||||||||||||||||||
| FFO payout ratio (4) (8) | 88% | 79% | —% | —% | —% | —% | |||||||||||||||||||||||||||||
| FFO as adjusted payout ratio (5) (8) | 69% | 87% | —% | —% | —% | —% | |||||||||||||||||||||||||||||
| AFFO payout ratio (6) (8) | 68% | 82% | —% | —% | —% | —% | |||||||||||||||||||||||||||||
| (1) See pages 24 through 26 for definitions. | |||||||||||||||||||||||||||||||||||
| (2) Adjusted EBITDAre is for the quarter multiplied times four. See calculation on page 30. | |||||||||||||||||||||||||||||||||||
| (3) See page 28 for detailed calculation. | |||||||||||||||||||||||||||||||||||
| (4) FFO payout ratio is calculated by dividing dividends declared per common share by FFO per diluted common share. | |||||||||||||||||||||||||||||||||||
| (5) FFO as adjusted payout ratio is calculated by dividing dividends declared per common share by FFO as adjusted per diluted common share. | |||||||||||||||||||||||||||||||||||
| (6) AFFO payout ratio is calculated by dividing dividends declared per common share by AFFO per diluted common share. | |||||||||||||||||||||||||||||||||||
| (7) Not presented as this ratio is not meaningful given the disruption caused by COVID-19 and the associated accounting for tenant rent deferrals and other lease modifications. | |||||||||||||||||||||||||||||||||||
| (8) The monthly cash dividend to common shareholders was temporarily suspended following the common share dividend paid on May 15, 2020 to shareholders of record as of April 30, 2020. On July 13, 2021, following termination of the Covenant Relief Period, the Company resumed regular monthly cash dividends to common shareholders. For both the three months ended September 30, 2021 and December 31, 2021, the Company declared cash dividends totaling $0.75 per common share. | |||||||||||||||||||||||||||||||||||
| ||||||||
| Q4 2021 Supplemental | Page 16 | |||||||
| SUMMARY OF MORTGAGE NOTES RECEIVABLE | |||||||||||||||||||||||
| (UNAUDITED, DOLLARS IN THOUSANDS) | |||||||||||||||||||||||
| CARRYING AMOUNT AS OF (1) | |||||||||||||||||||||||
| DESCRIPTION | INTEREST RATE | PAYOFF DATE/MATURITY DATE | OUTSTANDING PRINCIPAL AMOUNT OF MORTGAGE | DECEMBER 31, 2021 | DECEMBER 31, 2020 | ||||||||||||||||||
| Private school property Mableton, Georgia | 9.02 | % | Prepaid in full | $ | — | $ | — | $ | 5,278 | ||||||||||||||
Attraction property Powells Point, North Carolina | 7.75 | % | 6/30/2025 | 28,692 | 28,243 | 27,045 | |||||||||||||||||
| Fitness & wellness property Omaha, Nebraska | 7.85 | % | 1/3/2027 | 10,905 | 10,940 | 11,225 | |||||||||||||||||
Fitness & wellness property Merriam, Kansas | 7.55 | % | 7/31/2029 | 9,090 | 9,159 | 9,355 | |||||||||||||||||
Ski property Girdwood, Alaska | 8.20 | % | 12/31/2029 | 45,599 | 45,877 | 40,680 | |||||||||||||||||
| Fitness & wellness property Omaha, Nebraska | 7.85 | % | 6/30/2030 | 10,539 | 10,615 | 8,630 | |||||||||||||||||
Experiential lodging property Nashville, Tennessee | 7.01 | % | 9/30/2031 | 71,223 | 70,896 | 67,235 | |||||||||||||||||
Eat & play property Austin, Texas | 11.31 | % | 6/1/2033 | 10,779 | 10,874 | 11,929 | |||||||||||||||||
| Ski property West Dover and Wilmington, Vermont | 11.96 | % | 12/1/2034 | 51,050 | 51,047 | 51,031 | |||||||||||||||||
Four ski properties Ohio and Pennsylvania | 11.07 | % | 12/1/2034 | 37,562 | 37,519 | 37,413 | |||||||||||||||||
Ski property Chesterland, Ohio | 11.55 | % | 12/1/2034 | 4,550 | 4,516 | 4,396 | |||||||||||||||||
Ski property Hunter, New York | 8.72 | % | 1/5/2036 | 21,000 | 21,000 | 21,000 | |||||||||||||||||
| Eat & play property Midvale, Utah | 10.25 | % | 5/31/2036 | 17,505 | 17,639 | 18,289 | |||||||||||||||||
| Eat & play property West Chester, Ohio | 9.75 | % | 8/1/2036 | 18,068 | 18,198 | 18,830 | |||||||||||||||||
| Fitness & wellness property Fort Collins, Colorado | 7.85 | % | 1/31/2038 | 10,292 | 10,277 | 10,408 | |||||||||||||||||
| Early childhood education center Lake Mary, Florida | 7.98 | % | 5/9/2039 | 4,200 | 4,329 | 4,348 | |||||||||||||||||
Eat & play property Eugene, Oregon | 8.13 | % | 6/17/2039 | 14,700 | 14,996 | 14,799 | |||||||||||||||||
| Early childhood education center Lithia, Florida | 8.58 | % | 10/31/2039 | 3,959 | 4,034 | 3,737 | |||||||||||||||||
Total | $ | 369,713 | $ | 370,159 | $ | 365,628 | |||||||||||||||||
(1) Amounts include accrued interest.
| ||||||||
| Q4 2021 Supplemental | Page 17 | |||||||
| INVESTMENT SPENDING AND DISPOSITION SUMMARIES | |||||||||||||||||||||||
| (UNAUDITED, DOLLARS IN THOUSANDS) | |||||||||||||||||||||||
| INVESTMENT SPENDING THREE MONTHS ENDED DECEMBER 31, 2021 | |||||||||||||||||||||||
| INVESTMENT TYPE | TOTAL INVESTMENT SPENDING | NEW DEVELOPMENT | RE-DEVELOPMENT | ASSET ACQUISITION | MORTGAGE NOTES OR NOTES RECEIVABLE | INVESTMENT IN JOINT VENTURES | |||||||||||||||||
| Theatres | $ | 443 | $ | 397 | $ | 46 | $ | — | $ | — | $ | — | |||||||||||
| Eat & Play | 21,973 | — | (194) | 22,167 | — | — | |||||||||||||||||
| Attractions | 10 | — | 10 | — | — | — | |||||||||||||||||
| Ski | 994 | — | — | — | 994 | — | |||||||||||||||||
| Experiential Lodging | 2,174 | 729 | 24 | — | — | 1,421 | |||||||||||||||||
| Cultural | 5 | — | 5 | — | — | — | |||||||||||||||||
| Total Experiential | 25,599 | 1,126 | (109) | 22,167 | 994 | 1,421 | |||||||||||||||||
| Total Education | — | — | — | — | — | — | |||||||||||||||||
| Total Investment Spending | $ | 25,599 | $ | 1,126 | $ | (109) | $ | 22,167 | $ | 994 | $ | 1,421 | |||||||||||
| INVESTMENT SPENDING YEAR ENDED DECEMBER 31, 2021 | |||||||||||||||||||||||
| INVESTMENT TYPE | TOTAL INVESTMENT SPENDING | NEW DEVELOPMENT | RE-DEVELOPMENT | ASSET ACQUISITION | MORTGAGE NOTES OR NOTES RECEIVABLE | INVESTMENT IN JOINT VENTURES | |||||||||||||||||
| Theatres | $ | 4,633 | $ | 4,182 | $ | 451 | $ | — | $ | — | $ | — | |||||||||||
| Eat & Play | 58,387 | 9,347 | 121 | 48,919 | — | — | |||||||||||||||||
| Attractions | 56 | — | 56 | — | — | — | |||||||||||||||||
| Ski | 6,540 | — | — | — | 6,540 | — | |||||||||||||||||
| Experiential Lodging | 57,367 | 17,029 | 301 | — | — | 40,037 | |||||||||||||||||
| Cultural | 4,399 | — | 20 | — | 4,379 | — | |||||||||||||||||
| Fitness & Wellness | 2,124 | — | — | — | 2,124 | — | |||||||||||||||||
| Total Experiential | 133,506 | 30,558 | 949 | 48,919 | 13,043 | 40,037 | |||||||||||||||||
| Total Education | — | — | — | — | — | — | |||||||||||||||||
| Total Investment Spending | $ | 133,506 | $ | 30,558 | $ | 949 | $ | 48,919 | $ | 13,043 | $ | 40,037 | |||||||||||
| 2021 DISPOSITIONS | |||||||||||||||||||||||
| THREE MONTHS ENDED DECEMBER 31, 2021 | YEAR ENDED DECEMBER 31, 2021 | ||||||||||||||||||||||
| INVESTMENT TYPE | TOTAL DISPOSITIONS | NET PROCEEDS FROM SALE OF REAL ESTATE | NET PROCEEDS FROM PAYDOWN OF MORTGAGE NOTES | TOTAL DISPOSITIONS | NET PROCEEDS FROM SALE OF REAL ESTATE | NET PROCEEDS FROM PAYDOWN OF MORTGAGE NOTES | |||||||||||||||||
| Theatres | $ | 8,207 | $ | 8,207 | $ | — | $ | 36,841 | $ | 36,841 | $ | — | |||||||||||
| Eat & Play | 7,395 | 7,395 | — | 7,395 | 7,395 | — | |||||||||||||||||
| Ski | 48,000 | 48,000 | — | 48,000 | 48,000 | — | |||||||||||||||||
| Total Experiential | 63,602 | 63,602 | — | 92,236 | 92,236 | — | |||||||||||||||||
| Total Education | 1,715 | 1,715 | — | 8,979 | 3,901 | 5,078 | |||||||||||||||||
| Total Dispositions | $ | 65,317 | $ | 65,317 | $ | — | $ | 101,215 | $ | 96,137 | $ | 5,078 | |||||||||||
| ||||||||
| Q4 2021 Supplemental | Page 18 | |||||||
| PROPERTY UNDER DEVELOPMENT - INVESTMENT SPENDING ESTIMATES AT DECEMBER 31, 2021 (1) | ||||||||||||||||||||||||||||||||||||||||||||
| (UNAUDITED, DOLLARS IN THOUSANDS) | ||||||||||||||||||||||||||||||||||||||||||||
| DECEMBER 31, 2021 | OWNED BUILD-TO-SUIT SPENDING ESTIMATES | |||||||||||||||||||||||||||||||||||||||||||
| PROPERTY UNDER DEVELOPMENT | # OF PROJECTS | 1ST QUARTER 2022 | 2ND QUARTER 2022 | 3RD QUARTER 2022 | 4TH QUARTER 2022 | THEREAFTER | TOTAL EXPECTED COSTS (2) | % LEASED | ||||||||||||||||||||||||||||||||||||
| Total Build-to-Suit (3) | $ | 37,754 | 5 | $ | 1,982 | $ | 12,721 | $ | 1,667 | $ | — | $ | — | $ | 54,124 | 100 | % | |||||||||||||||||||||||||||
Non Build-to-Suit Development | 4,608 | |||||||||||||||||||||||||||||||||||||||||||
Total Property Under Development | $ | 42,362 | ||||||||||||||||||||||||||||||||||||||||||
| DECEMBER 31, 2021 | OWNED BUILD-TO-SUIT IN-SERVICE ESTIMATES | |||||||||||||||||||||||||||||||||||||||||||
| # OF PROJECTS | 1ST QUARTER 2022 | 2ND QUARTER 2022 | 3RD QUARTER 2022 | 4TH QUARTER 2022 | THEREAFTER | TOTAL IN-SERVICE (2) | ACTUAL IN-SERVICE 4TH QUARTER 2021 | |||||||||||||||||||||||||||||||||||||
| Total Build-to-Suit | 5 | $ | 397 | $ | 34,772 | $ | 1,105 | $ | 17,850 | $ | — | $ | 54,124 | $ | 1,670 | |||||||||||||||||||||||||||||
| DECEMBER 31, 2021 | MORTGAGE BUILD-TO-SUIT SPENDING ESTIMATES | |||||||||||||||||||||||||||||||||||||||||||
| MORTGAGE NOTES RECEIVABLE | # OF PROJECTS | 1ST QUARTER 2022 | 2ND QUARTER 2022 | 3RD QUARTER 2022 | 4TH QUARTER 2022 | THEREAFTER | TOTAL EXPECTED COSTS (2) | |||||||||||||||||||||||||||||||||||||
Total Build-to-Suit Mortgage Notes | $ | 56,491 | 2 | $ | 1,401 | $ | — | $ | 2,500 | $ | 2,500 | $ | 4,723 | $ | 67,615 | |||||||||||||||||||||||||||||
Non Build-to-Suit Mortgage Notes | 313,668 | |||||||||||||||||||||||||||||||||||||||||||
Total Mortgage Notes Receivable | $ | 370,159 | ||||||||||||||||||||||||||||||||||||||||||
| (1) This schedule includes only those properties for which the Company has commenced construction as of December 31, 2021. | ||||||||||||||||||||||||||||||||||||||||||||
| (2) "Total Expected Costs" and "Total In-Service" each reflect the total capital costs expected to be funded by the Company through completion (including capitalized interest or accrued interest as applicable). | ||||||||||||||||||||||||||||||||||||||||||||
| (3) Total Build-to-Suit excludes property under development related to the Company's real estate joint ventures that own recreation anchored lodging properties in St. Petersburg, Florida and Warrens, Wisconsin. The Company's spending for these two joint ventures is estimated at $1.9 million and $2.7 million, respectively, for 2022. | ||||||||||||||||||||||||||||||||||||||||||||
Note: This schedule includes future estimates for which the Company can give no assurance as to timing or amounts. Development projects have risks. See Item 1A - "Risk Factors" in the Company's most recent Annual Report on Form 10-K and, to the extent applicable, the Company's Quarterly Reports on Form 10-Q. | ||||||||||||||||||||||||||||||||||||||||||||
| ||||||||
| Q4 2021 Supplemental | Page 19 | |||||||
| PORTFOLIO DETAIL AS OF DECEMBER 31, 2021 | ||||||||||||||||||||||||||
| (UNAUDITED) | ||||||||||||||||||||||||||
| PROPERTY TYPE | PROPERTIES | OPERATORS | CONTRACTUAL CASH REVENUE (1) | STRATEGIC FOCUS | ||||||||||||||||||||||
| Theatres (2) | 175 | 18 | 45 | % | Reduce | |||||||||||||||||||||
| Eat & Play | 56 | 8 | (3) | 28 | % | Grow | ||||||||||||||||||||
| Attractions | 18 | 5 | 7 | % | Grow | |||||||||||||||||||||
| Ski | 11 | 3 | 7 | % | Grow | |||||||||||||||||||||
| Experiential Lodging | 8 | 2 | 4 | % | Grow | |||||||||||||||||||||
| Gaming | 1 | 1 | 2 | % | Grow | |||||||||||||||||||||
| Cultural | 3 | 2 | 1 | % | Grow | |||||||||||||||||||||
| Fitness & Wellness | 7 | 2 | 1 | % | Grow | |||||||||||||||||||||
| EXPERIENTIAL PORTFOLIO | 279 | 41 | 95 | % | ||||||||||||||||||||||
| Early Childhood Education | 65 | 7 | 3 | % | Reduce | |||||||||||||||||||||
| Private schools | 9 | 1 | 2 | % | Reduce | |||||||||||||||||||||
| EDUCATION PORTFOLIO | 74 | 8 | 5 | % | ||||||||||||||||||||||
| TOTAL PORTFOLIO | 353 | 49 | 100 | % | ||||||||||||||||||||||
(1) Contractual cash revenue is an operational measure and represents aggregate cash payments to which the Company is entitled under existing contracts, excluding the impact of any temporary abatements or deferrals, percentage rent (rents received over base amounts), non-cash revenue, and revenue from taxable REIT subsidiaries (TRSs) and investments in joint ventures. | ||||||||||||||||||||||||||
| (2) Excludes seven theatres located in Entertainment Districts (included in Eat & Play) | ||||||||||||||||||||||||||
| (3) Excludes non-theatre operators at Entertainment districts | ||||||||||||||||||||||||||
| ||||||||
| Q4 2021 Supplemental | Page 20 | |||||||
| LEASE EXPIRATIONS | |||||||||||||||||||||||
| AS OF DECEMBER 31, 2021 | |||||||||||||||||||||||
| (UNAUDITED, DOLLARS IN THOUSANDS) | |||||||||||||||||||||||
| YEAR | TOTAL NUMBER OF PROPERTIES | RENTAL REVENUE FOR THE YEAR ENDED DECEMBER 31, 2021 (1) | % OF TOTAL REVENUE | ||||||||||||||||||||
| 2022 | 1 | $ | 1,586 | — | % | ||||||||||||||||||
| 2023 | 2 | 953 | — | % | |||||||||||||||||||
| 2024 | 6 | 9,171 | 2 | % | |||||||||||||||||||
| 2025 | 2 | 2,656 | 1 | % | |||||||||||||||||||
| 2026 | 3 | 6,900 | 1 | % | |||||||||||||||||||
| 2027 | 8 | 18,246 | 3 | % | |||||||||||||||||||
| 2028 | 12 | 15,286 | 3 | % | |||||||||||||||||||
| 2029 | 12 | 13,233 | 2 | % | |||||||||||||||||||
| 2030 | 22 | 23,822 | 4 | % | |||||||||||||||||||
| 2031 | 13 | 10,279 | 2 | % | |||||||||||||||||||
| 2032 | 21 | 20,719 | 4 | % | |||||||||||||||||||
| 2033 | 10 | 10,974 | 2 | % | |||||||||||||||||||
| 2034 | 40 | 53,267 | 10 | % | |||||||||||||||||||
| 2035 | 32 | 76,503 | 14 | % | |||||||||||||||||||
| 2036 | 26 | 41,038 | 8 | % | |||||||||||||||||||
| 2037 | 32 | 61,228 | 12 | % | |||||||||||||||||||
| 2038 | 35 | 34,968 | 7 | % | |||||||||||||||||||
| 2039 | 4 | 6,739 | 1 | % | |||||||||||||||||||
| 2040 | 4 | 6,058 | 1 | % | |||||||||||||||||||
| 2041 | 30 | 15,058 | 3 | % | |||||||||||||||||||
| Thereafter | 7 | 15,254 | 3 | % | |||||||||||||||||||
| 322 | $ | 443,938 | 83 | % | |||||||||||||||||||
Note: This schedule excludes non-theatre tenant leases within the Company's entertainment districts, properties under development, land held for development, properties operated by the Company and investments in mortgage notes receivable. | |||||||||||||||||||||||
| (1) Rental revenue for the year ended December 31, 2021 includes lease revenue related to the Company's existing operating ground leases (leases in which the Company is a sub-lessor) as well as the gross-up of tenant reimbursed expenses recognized during the year ended December 31, 2021 in accordance with Accounting Standards Update (ASU) No. 2016-02 Leases (Topic 842). | |||||||||||||||||||||||
| ||||||||
| Q4 2021 Supplemental | Page 21 | |||||||
| TOP TEN CUSTOMERS BY PERCENTAGE OF TOTAL REVENUE | |||||||||||||||||
| (UNAUDITED) | |||||||||||||||||
| PERCENTAGE OF TOTAL REVENUE | PERCENTAGE OF TOTAL REVENUE | ||||||||||||||||
| FOR THE THREE MONTHS ENDED | FOR THE YEAR ENDED | ||||||||||||||||
| CUSTOMERS | DECEMBER 31, 2021 | DECEMBER 31, 2021 | |||||||||||||||
| 1. | AMC Theatres | 15.1% | 17.8% | ||||||||||||||
| 2. | Topgolf | 14.9% | 16.3% | ||||||||||||||
| 3. | Regal Entertainment Group | 13.7% | 8.4% | ||||||||||||||
| 4. | Cinemark | 6.8% | 8.0% | ||||||||||||||
| 5. | Vail Resorts | 4.5% | 5.2% | ||||||||||||||
| 6. | Camelback Resort | 3.6% | 4.1% | ||||||||||||||
| 7. | Resorts World | 3.2% | 2.5% | ||||||||||||||
| 8. | Premier Parks | 3.0% | 2.7% | ||||||||||||||
| 9. | Six Flags | 3.0% | 3.2% | ||||||||||||||
| 10. | Endeavor Schools | 2.4% | 2.8% | ||||||||||||||
| Total | 70.2% | 71.0% | |||||||||||||||
| ||||||||
| Q4 2021 Supplemental | Page 22 | |||||||
| GUIDANCE | |||||||||||||||||||||||
| (UNAUDITED, DOLLARS IN MILLION, EXCEPT PER SHARE DATA) | |||||||||||||||||||||||
| MEASURE | 2022 GUIDANCE | |||||||||||||
| Investment spending | $500.0 | to | $700.0 | |||||||||||
| Disposition proceeds and mortgage note payoff | $— | to | $10.0 | |||||||||||
| Percentage rent and participating interest income | $8.0 | to | $12.0 | |||||||||||
| General and administrative expense | $49.0 | to | $52.0 | |||||||||||
| FFO per diluted share | $4.24 | to | $4.44 | |||||||||||
| FFO as adjusted (FFOAA) per diluted share | $4.30 | to | $4.50 | |||||||||||
| RECONCILIATION FROM NET INCOME AVAILABLE TO COMMON SHAREHOLDERS OF EPR PROPERTIES (PER DILUTED SHARE): | 2022 GUIDANCE | |||||||||||||
| Net income available to common shareholders of EPR Properties | $2.06 | to | $2.26 | |||||||||||
| Real estate depreciation and amortization | 2.14 | |||||||||||||
| Allocated share of joint venture depreciation | 0.08 | |||||||||||||
| Impact of Series C and Series E Dilution, if applicable | (0.04) | |||||||||||||
| FFO available to common shareholders of EPR Properties | $4.24 | to | $4.44 | |||||||||||
| Transaction costs | 0.06 | |||||||||||||
| FFO as adjusted (FFOAA) available to common shareholders of EPR Properties | $4.30 | to | $4.50 | |||||||||||
| ||||||||
| Q4 2021 Supplemental | Page 23 | |||||||
| DEFINITIONS - NON-GAAP FINANCIAL MEASURES | ||||||||||||||
EBITDAre
The National Association of Real Estate Investment Trusts (“NAREIT”) developed EBITDAre as a relative non-GAAP financial measure of REITs, independent of a company's capital structure, to provide a uniform basis to measure the enterprise value of a company. Pursuant to the definition of EBITDAre by the Board of Governors of NAREIT, the Company calculates EBITDAre as net income (loss), computed in accordance with GAAP, excluding interest expense (net), income tax expense (benefit), depreciation and amortization, gains and losses from disposition of real estate, impairment losses on real estate, costs associated with loan refinancing or payoff and adjustments for unconsolidated partnerships, joint ventures and other affiliates. Management provides EBITDAre herein because it believes this information is useful to investors as a supplemental performance measure as it can help facilitate comparisons of operating performance between periods and with other REITs. The Company's method of calculating EBITDAre may be different from methods used by other REITs and, accordingly, may not be comparable to such other REITs. EBITDAre is not a measure of performance under GAAP, does not represent cash generated from operations as defined by GAAP and is not indicative of cash available to fund all cash needs, including distributions. This measure should not be considered an alternative to net income (loss) or any other GAAP measure as a measurement of the results of the Company's operations or cash flows or liquidity as defined by GAAP.
ADJUSTED EBITDAre
Management uses Adjusted EBITDAre in its analysis of the performance of the business and operations of the Company. Management believes Adjusted EBITDAre is useful to investors because it excludes various items that management believes are not indicative of operating performance, and that it is an informative measure to use in computing various financial ratios to evaluate the Company. The Company defines Adjusted EBITDAre as EBITDAre (defined above) for the quarter excluding gain on insurance recovery, severance expense, credit loss (benefit) expense, transaction costs, impairment losses on operating lease right-of-use assets and prepayment fees. This number for the quarter is then multiplied by four to get an annual amount. Additionally, for the year ended December 31, 2020, Adjusted EBITDAre was further adjusted to add back prior period receivable write-offs related to certain theatre tenants placed on cash basis or receiving abatements during the respective periods.
The Company's method of calculating Adjusted EBITDAre may be different from methods used by other REITs and, accordingly, may not be comparable to such other REITs. Adjusted EBITDAre is not a measure of performance under GAAP, does not represent cash generated from operations as defined by GAAP and is not indicative of cash available to fund all cash needs, including distributions. This measure should not be considered as an alternative to net income (loss) or any other GAAP measure as a measurement of the results of the Company's operations or cash flows or liquidity as defined by GAAP.
NET DEBT
Net Debt represents debt (reported in accordance with GAAP) adjusted to exclude deferred financing costs, net and reduced for cash and cash equivalents. By excluding deferred financing costs, net and reducing debt for cash and cash equivalents on hand, the result provides an estimate of the contractual amount of borrowed capital to be repaid, net of cash available to repay it. The Company believes this calculation constitutes a beneficial supplemental non-GAAP financial disclosure to investors in understanding its financial condition. The Company's method of calculating Net Debt may be different from methods used by other REITs and, accordingly, may not be comparable to such other REITs.
NET DEBT TO ADJUSTED EBITDAre RATIO AND NET DEBT TO GROSS ASSETS RATIO
Net Debt to Adjusted EBITDAre Ratio and Net Debt to Gross Asset Ratio are supplemental measures derived from non-GAAP financial measures that the Company uses to evaluate its capital structure and the magnitude of its debt against its operating performance. The Company believes that investors commonly use versions of these ratios in a similar manner. In addition, financial institutions use versions of these ratios in connection with debt agreements to set pricing and covenant limitations. The Company's method of calculating Net Debt to Adjusted EBITDAre Ratio and Net Debt to Gross Assets Ratio may be different from methods used by other REITs and, accordingly, may not be comparable to such other REITs.
| ||||||||
| Q4 2021 Supplemental | Page 24 | |||||||
FUNDS FROM OPERATIONS (“FFO”) AND FFO AS ADJUSTED
NAREIT developed FFO as a relative non-GAAP financial measure of performance of an equity REIT in order to recognize that income-producing real estate historically has not depreciated on the basis determined under GAAP and management provides FFO herein because it believes this information is useful to investors in this regard. FFO is a widely used measure of the operating performance of real estate companies and is provided here as a supplemental measure to GAAP net income (loss) available to common shareholders and earnings per share. Pursuant to the definition of FFO by the Board of Governors of NAREIT, the Company calculates FFO as net income (loss) available to common shareholders, computed in accordance with GAAP, excluding gains and losses from disposition of real estate and impairment losses on real estate, plus real estate related depreciation and amortization, and after adjustments for unconsolidated partnerships, joint ventures and other affiliates. Adjustments for unconsolidated partnerships, joint ventures and other affiliates are calculated to reflect FFO on the same basis. The Company has calculated FFO for all periods presented in accordance with this definition. In addition, the Company presents FFO as adjusted. Management believes it is useful to provide FFO as adjusted as a supplemental measure to GAAP net income (loss) available to common shareholders and earnings per share. FFO as adjusted is FFO plus costs associated with loan refinancing or payoff, transaction costs, severance expense, preferred share redemption costs, impairment of operating lease right-of-use assets and credit loss (benefit) expense, and by subtracting gain on insurance recovery and deferred income tax expense (benefit). FFO and FFO as adjusted are non-GAAP financial measures. FFO and FFO as adjusted do not represent cash flows from operations as defined by GAAP and are not indicative that cash flows are adequate to fund all cash needs and are not to be considered an alternative to net income (loss) or any other GAAP measure as a measurement of the results of the Company's operations, cash flows or liquidity as defined by GAAP. It should also be noted that not all REITs calculate FFO and FFO as adjusted the same way so comparisons with other REITs may not be meaningful.
ADJUSTED FUNDS FROM OPERATIONS (“AFFO”)
In addition to FFO, the Company presents AFFO by adding to FFO costs associated with loan refinancing or payoff, transaction costs, credit loss (benefit) expense, severance expense, preferred share redemption costs, impairment of operating lease right-of-use assets, termination fees associated with tenants' exercises of public charter school buy-out options, non-real estate depreciation and amortization, deferred financing fees amortization, share-based compensation expense to management and trustees and amortization of above and below market leases, net and tenant allowances and by subtracting maintenance capital expenditures (including second generation tenant improvements and leasing commissions), straight-lined rental revenue (removing the impact of straight-line ground sublease expense), non-cash portion of mortgage and other financing income, gain on insurance recovery and deferred income tax (benefit) expense. AFFO is a widely used measure of the operating performance of real estate companies and is provided here as a supplemental measure to GAAP net income (loss) available to common shareholders and earnings per share and management provides AFFO herein because it believes this information is useful to investors in this regard. AFFO is a non-GAAP financial measure. AFFO does not represent cash flows from operations as defined by GAAP and is not indicative that cash flows are adequate to fund all cash needs and is not to be considered an alternative to net income (loss) or any other GAAP measure as a measurement of the results of the Company's operations or its cash flows or liquidity as defined by GAAP. It should also be noted that not all REITs calculate AFFO the same way so comparisons with other REITs may not be meaningful.
INTEREST COVERAGE RATIO
The interest coverage ratio is calculated as the interest coverage amount divided by interest expense, gross. The Company calculates the interest coverage amount by adding to net income (loss) impairment charges, credit loss (benefit) expense, transaction costs, interest expense, gross (including interest expense in discontinued operations), severance expense, depreciation and amortization, share-based compensation expense to management and trustees and costs associated with loan refinancing or payoff; subtracting interest cost capitalized, straight-line rental revenue, gain on early extinguishment of debt, gain (loss) on sale of real estate from continuing and discontinued operations, gain on insurance recovery, gain on previously held equity interest, gain on early extinguishment of debt, prepayment fees and deferred income tax benefit (expense). The Company calculates interest expense, gross, by adding to interest expense, net, interest income and interest cost capitalized. The Company considers the interest coverage ratio to be an appropriate supplemental measure of a company’s ability to meet its interest expense obligations and management believes it is useful to investors in this regard. The Company's calculation of the interest coverage ratio may be different from the calculation used by other companies, and therefore, comparability may be limited. This information should not be considered as an alternative to any GAAP liquidity measures.
| ||||||||
| Q4 2021 Supplemental | Page 25 | |||||||
FIXED CHARGE COVERAGE RATIO
The fixed charge coverage ratio is calculated in exactly the same manner as the interest coverage ratio, except that interest expense, gross and preferred share dividends are also added to the denominator. The Company considers the fixed charge coverage ratio to be an appropriate supplemental measure of a company’s ability to make its interest and preferred share dividend payments and management believes it is useful to investors in this regard. The Company's calculation of the fixed charge coverage ratio may be different from the calculation used by other companies and, therefore, comparability may be limited. This information should not be considered as an alternative to any GAAP liquidity measures.
DEBT SERVICE COVERAGE RATIO
The debt service coverage ratio is calculated in exactly the same manner as the interest coverage ratio, except that interest expense, gross and recurring principal payments are also added to the denominator. The Company considers the debt service coverage ratio to be an appropriate supplemental measure of a company’s ability to make its debt service payments and management believes it is useful to investors in this regard. The Company's calculation of the debt service coverage ratio may be different from the calculation used by other companies and, therefore, comparability may be limited. This information should not be considered as an alternative to any GAAP liquidity measures.
| ||||||||
| Q4 2021 Supplemental | Page 26 | |||||||

| Appendix to Supplemental Operating and Financial Data | ||||||||||||||||||||||||||
| Reconciliation of Certain Non-GAAP Financial Measures | ||||||||||||||||||||||||||
| Fourth Quarter and Year Ended December 31, 2021 | ||||||||||||||||||||||||||
| ||||||||
| Q4 2021 Supplemental | Page 27 | |||||||
| CALCULATION OF INTEREST, FIXED CHARGE AND DEBT SERVICE COVERAGE RATIOS | |||||||||||||||||||||||||||||||||||
| (UNAUDITED, DOLLARS IN THOUSANDS) | |||||||||||||||||||||||||||||||||||
| INTEREST COVERAGE RATIO (1): | 4TH QUARTER 2021 | 3RD QUARTER 2021 | 2ND QUARTER 2021 | 1ST QUARTER 2021 | 4TH QUARTER 2020 | 3RD QUARTER 2020 | |||||||||||||||||||||||||||||
| Net income (loss) | $ | 44,557 | $ | 32,117 | $ | 18,552 | $ | 3,380 | $ | (19,977) | $ | (85,904) | |||||||||||||||||||||||
| Impairment charges | — | 2,711 | — | — | 22,832 | 11,561 | |||||||||||||||||||||||||||||
| Transaction costs | 60 | 2,132 | 662 | 548 | 814 | 2,776 | |||||||||||||||||||||||||||||
| Credit loss (benefit) expense | (2,295) | (14,096) | (2,819) | (2,762) | 20,312 | 5,707 | |||||||||||||||||||||||||||||
| Interest expense, gross | 34,251 | 36,841 | 38,869 | 39,854 | 43,341 | 42,312 | |||||||||||||||||||||||||||||
| Severance expense | — | — | — | — | 2,868 | — | |||||||||||||||||||||||||||||
| Depreciation and amortization | 40,294 | 42,612 | 40,538 | 40,326 | 42,014 | 42,059 | |||||||||||||||||||||||||||||
| Share-based compensation expense | |||||||||||||||||||||||||||||||||||
| to management and trustees | 3,685 | 3,759 | 3,675 | 3,784 | 3,437 | 3,410 | |||||||||||||||||||||||||||||
| Costs associated with loan refinancing or payoff | 20,469 | 4,741 | — | 241 | 812 | — | |||||||||||||||||||||||||||||
| Interest cost capitalized | (225) | (233) | (514) | (595) | (404) | (325) | |||||||||||||||||||||||||||||
| Straight-line rental revenue | (1,974) | (981) | (1,420) | (1,289) | (898) | 17,969 | |||||||||||||||||||||||||||||
Gain on sale of real estate | (16,382) | (787) | (511) | (201) | (49,877) | — | |||||||||||||||||||||||||||||
Gain on insurance recovery | (1,151) | — | — | (30) | (809) | — | |||||||||||||||||||||||||||||
| Deferred income tax expense | — | — | — | — | — | 18,035 | |||||||||||||||||||||||||||||
| Interest coverage amount | $ | 121,289 | $ | 108,816 | $ | 97,032 | $ | 83,256 | $ | 64,465 | $ | 57,600 | |||||||||||||||||||||||
| Interest expense, net | $ | 34,005 | $ | 36,584 | $ | 38,312 | $ | 39,194 | $ | 42,838 | $ | 41,744 | |||||||||||||||||||||||
| Interest income | 21 | 24 | 43 | 65 | 99 | 243 | |||||||||||||||||||||||||||||
| Interest cost capitalized | 225 | 233 | 514 | 595 | 404 | 325 | |||||||||||||||||||||||||||||
| Interest expense, gross | $ | 34,251 | $ | 36,841 | $ | 38,869 | $ | 39,854 | $ | 43,341 | $ | 42,312 | |||||||||||||||||||||||
| Interest coverage ratio | 3.5 | Footnote 2 | Footnote 2 | Footnote 2 | Footnote 2 | Footnote 2 | |||||||||||||||||||||||||||||
| FIXED CHARGE COVERAGE RATIO (1): | |||||||||||||||||||||||||||||||||||
| Interest coverage amount | $ | 121,289 | $ | 108,816 | $ | 97,032 | $ | 83,256 | $ | 64,465 | $ | 57,600 | |||||||||||||||||||||||
| Interest expense, gross | $ | 34,251 | $ | 36,841 | $ | 38,869 | $ | 39,854 | $ | 43,341 | $ | 42,312 | |||||||||||||||||||||||
| Preferred share dividends | 6,034 | 6,033 | 6,033 | 6,034 | 6,034 | 6,034 | |||||||||||||||||||||||||||||
| Fixed charges | $ | 40,285 | $ | 42,874 | $ | 44,902 | $ | 45,888 | $ | 49,375 | $ | 48,346 | |||||||||||||||||||||||
| Fixed charge coverage ratio | 3.0 | Footnote 2 | Footnote 2 | Footnote 2 | Footnote 2 | Footnote 2 | |||||||||||||||||||||||||||||
| DEBT SERVICE COVERAGE RATIO (1): | |||||||||||||||||||||||||||||||||||
| Interest coverage amount | $ | 121,289 | $ | 108,816 | $ | 97,032 | $ | 83,256 | $ | 64,465 | $ | 57,600 | |||||||||||||||||||||||
| Interest expense, gross | $ | 34,251 | $ | 36,841 | $ | 38,869 | $ | 39,854 | $ | 43,341 | $ | 42,312 | |||||||||||||||||||||||
| Recurring principal payments | — | — | — | — | — | — | |||||||||||||||||||||||||||||
| Debt service | $ | 34,251 | $ | 36,841 | $ | 38,869 | $ | 39,854 | $ | 43,341 | $ | 42,312 | |||||||||||||||||||||||
| Debt service coverage ratio | 3.5 | Footnote 2 | Footnote 2 | Footnote 2 | Footnote 2 | Footnote 2 | |||||||||||||||||||||||||||||
| (1) See pages 24 through 26 for definitions. | |||||||||||||||||||||||||||||||||||
| (2) Not presented as this ratio for this period is not meaningful given the disruption caused by the COVID-19 pandemic and the associated accounting for tenant rent deferrals and other lease modifications. | |||||||||||||||||||||||||||||||||||
| ||||||||
| Q4 2021 Supplemental | Page 28 | |||||||
| RECONCILIATION OF INTEREST COVERAGE AMOUNT TO NET CASH PROVIDED BY OPERATING ACTIVITIES | ||||||||||||||||||||||||||||||||||||||
| (UNAUDITED, DOLLARS IN THOUSANDS) | ||||||||||||||||||||||||||||||||||||||
| The interest coverage amount per the table on page 28 is a non-GAAP financial measure and should not be considered an alternative to any GAAP liquidity measures. It is most directly comparable to the GAAP liquidity measure, “Net cash provided by operating activities,” and is not directly comparable to the GAAP liquidity measures, “Net cash used by investing activities” and “Net cash provided by financing activities.” The interest coverage amount can be reconciled to “Net cash provided by operating activities” per the consolidated statements of cash flows as follows: | ||||||||||||||||||||||||||||||||||||||
| 4TH QUARTER 2021 | 3RD QUARTER 2021 | 2ND QUARTER 2021 | 1ST QUARTER 2021 | 4TH QUARTER 2020 | 3RD QUARTER 2020 | |||||||||||||||||||||||||||||||||
| Net cash provided by operating activities | $ | 70,501 | $ | 95,624 | $ | 62,494 | $ | 78,306 | $ | 5,795 | $ | 2,065 | ||||||||||||||||||||||||||
| Equity in loss from joint ventures | (2,059) | (418) | (1,151) | (1,431) | (1,364) | (1,044) | ||||||||||||||||||||||||||||||||
| Distributions from joint ventures | — | — | — | (90) | — | — | ||||||||||||||||||||||||||||||||
| Amortization of deferred financing costs | (2,335) | (2,210) | (1,574) | (1,547) | (1,823) | (1,498) | ||||||||||||||||||||||||||||||||
| Amortization of above and below market leases, net and tenant allowances | 92 | 98 | 99 | 96 | 96 | 124 | ||||||||||||||||||||||||||||||||
| Changes in assets and liabilities, net: | ||||||||||||||||||||||||||||||||||||||
| Amortization of operating lease assets and liabilities | 172 | 146 | 113 | 120 | 230 | (14) | ||||||||||||||||||||||||||||||||
| Mortgage notes and related accrued interest receivable | (557) | (154) | 423 | (280) | 3,297 | 1,154 | ||||||||||||||||||||||||||||||||
| Accounts receivable | (1,177) | (10,692) | (6,265) | (18,687) | 4,422 | (5,053) | ||||||||||||||||||||||||||||||||
| Other assets | (642) | (4,396) | (1,003) | 7,323 | (367) | (2,208) | ||||||||||||||||||||||||||||||||
| Accounts payable and accrued liabilities | 14,164 | (7,230) | 2,716 | (997) | 404 | (4,348) | ||||||||||||||||||||||||||||||||
| Unearned rents and interest | 11,018 | 289 | 3,583 | (18,075) | 9,312 | 5,690 | ||||||||||||||||||||||||||||||||
| Straight-line rental revenue | (1,974) | (981) | (1,420) | (1,289) | (898) | 17,969 | ||||||||||||||||||||||||||||||||
| Interest expense, gross | 34,251 | 36,841 | 38,869 | 39,854 | 43,341 | 42,312 | ||||||||||||||||||||||||||||||||
| Interest cost capitalized | (225) | (233) | (514) | (595) | (404) | (325) | ||||||||||||||||||||||||||||||||
| Transaction costs | 60 | 2,132 | 662 | 548 | 814 | 2,776 | ||||||||||||||||||||||||||||||||
| Severance expense (cash portion) | — | — | — | — | 1,610 | — | ||||||||||||||||||||||||||||||||
| Interest coverage amount (1) | $ | 121,289 | $ | 108,816 | $ | 97,032 | $ | 83,256 | $ | 64,465 | $ | 57,600 | ||||||||||||||||||||||||||
| Net cash provided (used) by investing activities | $ | 41,339 | $ | (12,711) | $ | 3,128 | $ | (29,894) | $ | 204,883 | $ | (17,919) | ||||||||||||||||||||||||||
| Net cash provided (used) by financing activities | $ | 28,595 | $ | (446,643) | $ | (96,195) | $ | (532,435) | $ | (170,716) | $ | (5,994) | ||||||||||||||||||||||||||
| (1) See pages 24 through 26 for definitions. | ||||||||||||||||||||||||||||||||||||||
| ||||||||
| Q4 2021 Supplemental | Page 29 | |||||||
| RECONCILIATION OF EBITDAre and ADJUSTED EBITDAre | ||||||||||||||||||||||||||||||||||||||
| (UNAUDITED, DOLLARS IN THOUSANDS) | ||||||||||||||||||||||||||||||||||||||
| ADJUSTED EBITDAre (3): | 4TH QUARTER 2021 | 3RD QUARTER 2021 | 2ND QUARTER 2021 | 1ST QUARTER 2021 | 4TH QUARTER 2020 | 3RD QUARTER 2020 | ||||||||||||||||||||||||||||||||
| Net income (loss) | $ | 44,557 | $ | 32,117 | $ | 18,552 | $ | 3,380 | $ | (19,977) | $ | (85,904) | ||||||||||||||||||||||||||
| Interest expense, net | 34,005 | 36,584 | 38,312 | 39,194 | 42,838 | 41,744 | ||||||||||||||||||||||||||||||||
| Income tax expense | 397 | 395 | 398 | 407 | 402 | 18,417 | ||||||||||||||||||||||||||||||||
| Depreciation and amortization | 40,294 | 42,612 | 40,538 | 40,326 | 42,014 | 42,059 | ||||||||||||||||||||||||||||||||
| Gain on sale of real estate | (16,382) | (787) | (511) | (201) | (49,877) | — | ||||||||||||||||||||||||||||||||
| Impairment of real estate investments, net | — | 2,711 | — | — | 22,832 | 11,561 | ||||||||||||||||||||||||||||||||
| Costs associated with loan refinancing or payoff | 20,469 | 4,741 | — | 241 | 812 | — | ||||||||||||||||||||||||||||||||
| Allocated share of joint venture depreciation | 1,561 | 966 | 459 | 354 | 361 | 369 | ||||||||||||||||||||||||||||||||
| Allocated share of joint venture interest expense | 1,145 | 981 | 846 | 789 | 872 | 741 | ||||||||||||||||||||||||||||||||
| EBITDAre | $ | 126,046 | $ | 120,320 | $ | 98,594 | $ | 84,490 | $ | 40,277 | $ | 28,987 | ||||||||||||||||||||||||||
| Gain on insurance recovery (1) | (1,151) | — | — | (30) | (809) | — | ||||||||||||||||||||||||||||||||
| Severance expense | — | — | — | — | 2,868 | — | ||||||||||||||||||||||||||||||||
| Transaction costs | 60 | 2,132 | 662 | 548 | 814 | 2,776 | ||||||||||||||||||||||||||||||||
| Credit loss (benefit) expense | (2,295) | (14,096) | (2,819) | (2,762) | 20,312 | 5,707 | ||||||||||||||||||||||||||||||||
| Accounts receivable write-offs from prior periods (2) | — | — | — | — | 4,301 | 13,533 | ||||||||||||||||||||||||||||||||
| Straight-line receivable write-offs from prior periods (2) | — | — | — | — | 870 | 19,927 | ||||||||||||||||||||||||||||||||
| Adjusted EBITDAre | $ | 122,660 | $ | 108,356 | $ | 96,437 | $ | 82,246 | $ | 68,633 | $ | 70,930 | ||||||||||||||||||||||||||
| Adjusted EBITDAre (annualized) (4) | $ | 490,640 | Footnote 5 | Footnote 5 | Footnote 5 | Footnote 5 | Footnote 5 | |||||||||||||||||||||||||||||||
| See footnotes on following page. | ||||||||||||||||||||||||||||||||||||||
| ||||||||
| Q4 2021 Supplemental | Page 30 | |||||||
| (1) Included in other income in the consolidated statements of income (loss) in the Company's Annual Reports on Form 10-K and the Company's Quarterly Reports on Form 10-Q. Reconciliation is as follows: | ||||||||||||||||||||||||||||||||||||||
| 4TH QUARTER 2021 | 3RD QUARTER 2021 | 2ND QUARTER 2021 | 1ST QUARTER 2021 | 4TH QUARTER 2020 | 3RD QUARTER 2020 | |||||||||||||||||||||||||||||||||
| Income (loss) from settlement of foreign currency swap contracts | 41 | 39 | (28) | 52 | 110 | 154 | ||||||||||||||||||||||||||||||||
| Gain on insurance recovery | 1,151 | — | — | 30 | 809 | — | ||||||||||||||||||||||||||||||||
| Operating income from operated properties | 7,815 | 7,860 | 848 | 295 | 45 | 16 | ||||||||||||||||||||||||||||||||
| Fee income | — | 187 | — | — | — | — | ||||||||||||||||||||||||||||||||
| Miscellaneous income | 7 | 5 | 213 | 301 | 4 | 12 | ||||||||||||||||||||||||||||||||
| Other income | $ | 9,014 | $ | 8,091 | $ | 1,033 | $ | 678 | $ | 968 | $ | 182 | ||||||||||||||||||||||||||
| (2) Included in rental revenue from continuing operations in the consolidated statements of income (loss) in the Company's Annual Reports on Form 10-K and the Company's Quarterly Reports on Form 10-Q. Reconciliation is as follows: | ||||||||||||||||||||||||||||||||||||||
| 4TH QUARTER 2021 | 3RD QUARTER 2021 | 2ND QUARTER 2021 | 1ST QUARTER 2021 | 4TH QUARTER 2020 | 3RD QUARTER 2020 | |||||||||||||||||||||||||||||||||
| Minimum rent | $ | 123,463 | $ | 114,375 | $ | 107,100 | $ | 94,190 | $ | 79,342 | $ | 83,230 | ||||||||||||||||||||||||||
| Accounts receivable write-offs from prior periods | — | — | — | — | (4,301) | (13,533) | ||||||||||||||||||||||||||||||||
| Tenant reimbursements | 4,712 | 4,187 | 5,000 | 4,822 | 4,831 | 2,413 | ||||||||||||||||||||||||||||||||
| Percentage rent | 6,851 | 3,149 | 2,016 | 2,030 | 3,040 | 1,303 | ||||||||||||||||||||||||||||||||
| Straight-line rental revenue | 1,974 | 981 | 1,420 | 1,289 | 1,768 | 1,958 | ||||||||||||||||||||||||||||||||
| Straight-line write-offs from prior periods | — | — | — | — | (870) | (19,927) | ||||||||||||||||||||||||||||||||
| Other rental revenue | 345 | 348 | 347 | 283 | 201 | 147 | ||||||||||||||||||||||||||||||||
| Rental revenue | $ | 137,345 | $ | 123,040 | $ | 115,883 | $ | 102,614 | $ | 84,011 | $ | 55,591 | ||||||||||||||||||||||||||
| (3) See pages 24 through 26 for definitions. | ||||||||||||||||||||||||||||||||||||||
| (4) Adjusted EBITDAre for the quarter is multiplied by four to calculate an annualized amount. | ||||||||||||||||||||||||||||||||||||||
| (5) Not presented as this metric is not meaningful given the disruption caused by the COVID-19 pandemic and the associated accounting for tenant rent deferrals and other lease modifications. | ||||||||||||||||||||||||||||||||||||||
| ||||||||
| Q4 2021 Supplemental | Page 31 | |||||||