2 The financial results in this document reflect preliminary, unaudited results, which are not final until the Company’s Annual Report on Form 10-K is filed. With the exception of historical information, certain statements contained or incorporated by reference herein may contain forward-looking statements within the meaning of Section 27A of the Securities Act of 1933, as amended (the “Securities Act”), and Section 21E of the Securities Exchange Act of 1934, as amended (the “Exchange Act”), such as those pertaining to our guidance, our capital resources and liquidity, our pursuit of growth opportunities, the timing of transaction closings and investment spending, our ongoing negotiations to exit from certain joint ventures or the ultimate terms of any such exit, our expected cash flows, the performance of our customers, our expected cash collections and our results of operations and financial condition. Forward-looking statements involve numerous risks and uncertainties, and you should not rely on them as predictions of actual events. There is no assurance that the events or circumstances reflected in the forward-looking statements will occur. You can identify forward-looking statements by use of words such as “will be,” “intend,” “continue,” “believe,” “may,” “expect,” “hope,” “anticipate,” “goal,” “forecast,” “pipeline,” “estimates,” “offers,” “plans,” “would” or other similar expressions or other comparable terms or discussions of strategy, plans or intentions contained or incorporated by reference herein. Forward-looking statements necessarily are dependent on assumptions, data or methods that may be incorrect or imprecise. These forward-looking statements represent our intentions, plans, expectations and beliefs and are subject to numerous assumptions, risks and uncertainties. Many of the factors that will determine these items are beyond our ability to control or predict. For further discussion of these factors see “Item 1A. Risk Factors” in our most recent Annual Report on Form 10-K and, to the extent applicable, our Quarterly Reports on Form 10-Q. For these statements, we claim the protection of the safe harbor for forward-looking statements contained in the Private Securities Litigation Reform Act of 1995. You are cautioned not to place undue reliance on our forward-looking statements, which speak only as of the date hereof or the date of any document incorporated by reference herein. All subsequent written and oral forward-looking statements attributable to us or any person acting on our behalf are expressly qualified in their entirety by the cautionary statements contained or referred to in this section. Except as required by law, we do not undertake any obligation to release publicly any revisions to our forward-looking statements to reflect events or circumstances after the date hereof. DISCLAIMER
INTRODUCTORY COMMENTS
4 QUARTERLY HIGHLIGHTS Growth: Q3 revenue up 12% & FFO as adjusted per share up 8.8% Strong Investments Broadened Experiential Portfolio • Established important new relationships • Entered Live Venues category with Live Nation in Portland, OR • Acquired Life Time Fitness property in Irvine, CA Portfolio Coverage Incrementally Increased: coverage at 2.1x Continue to Draw on Multiple Sources of Capital • Recycled capital through sale of private school • Entered into forward sale agreements under ATM • Executed new credit agreement with $600M term loan • Have capacity to fund strong pipeline of opportunities with credit facilities & forward equity in place Raising Guidance: increasing 2026 investment spending & earnings guidance; earnings midpoint at 8% increase over 2025 Continued Growth Acceleration & Momentum Across the Business

PORTFOLIO
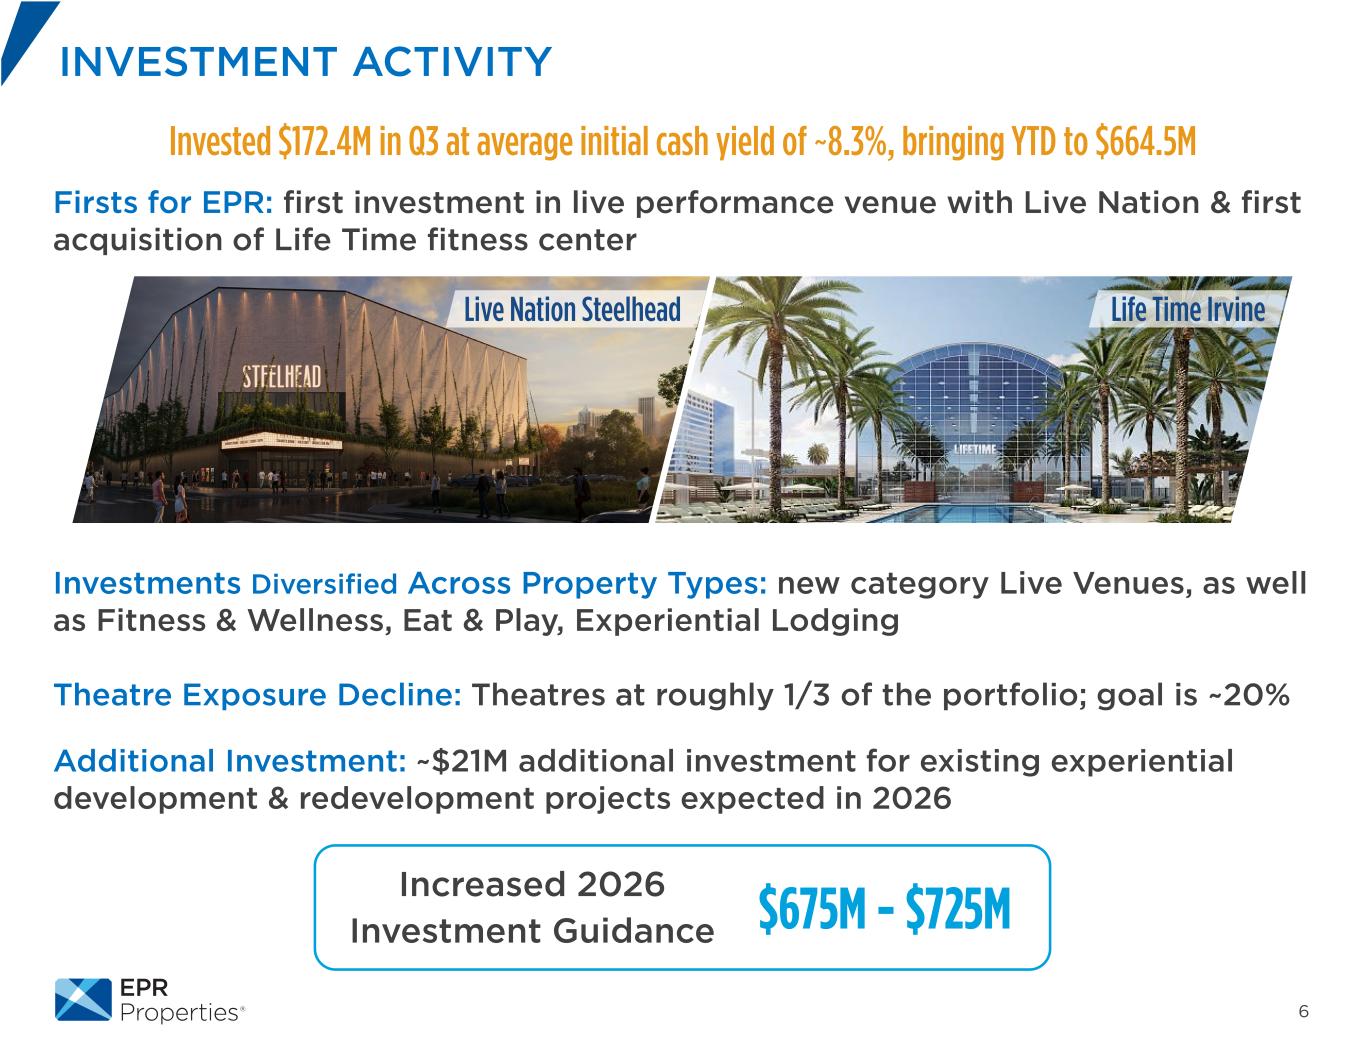
6 Firsts for EPR: first investment in live performance venue with Live Nation & first acquisition of Life Time fitness center Investments Diversified Across Property Types: new category Live Venues, as well as Fitness & Wellness, Eat & Play, Experiential Lodging Theatre Exposure Decline: Theatres at roughly 1/3 of the portfolio; goal is ~20% Additional Investment: ~$21M additional investment for existing experiential development & redevelopment projects expected in 2026 INVESTMENT ACTIVITY Invested $172.4M in Q3 at average initial cash yield of ~8.3%, bringing YTD to $664.5M Increased 2026 Investment Guidance $675M - $725M Live Nation Steelhead Life Time Irvine
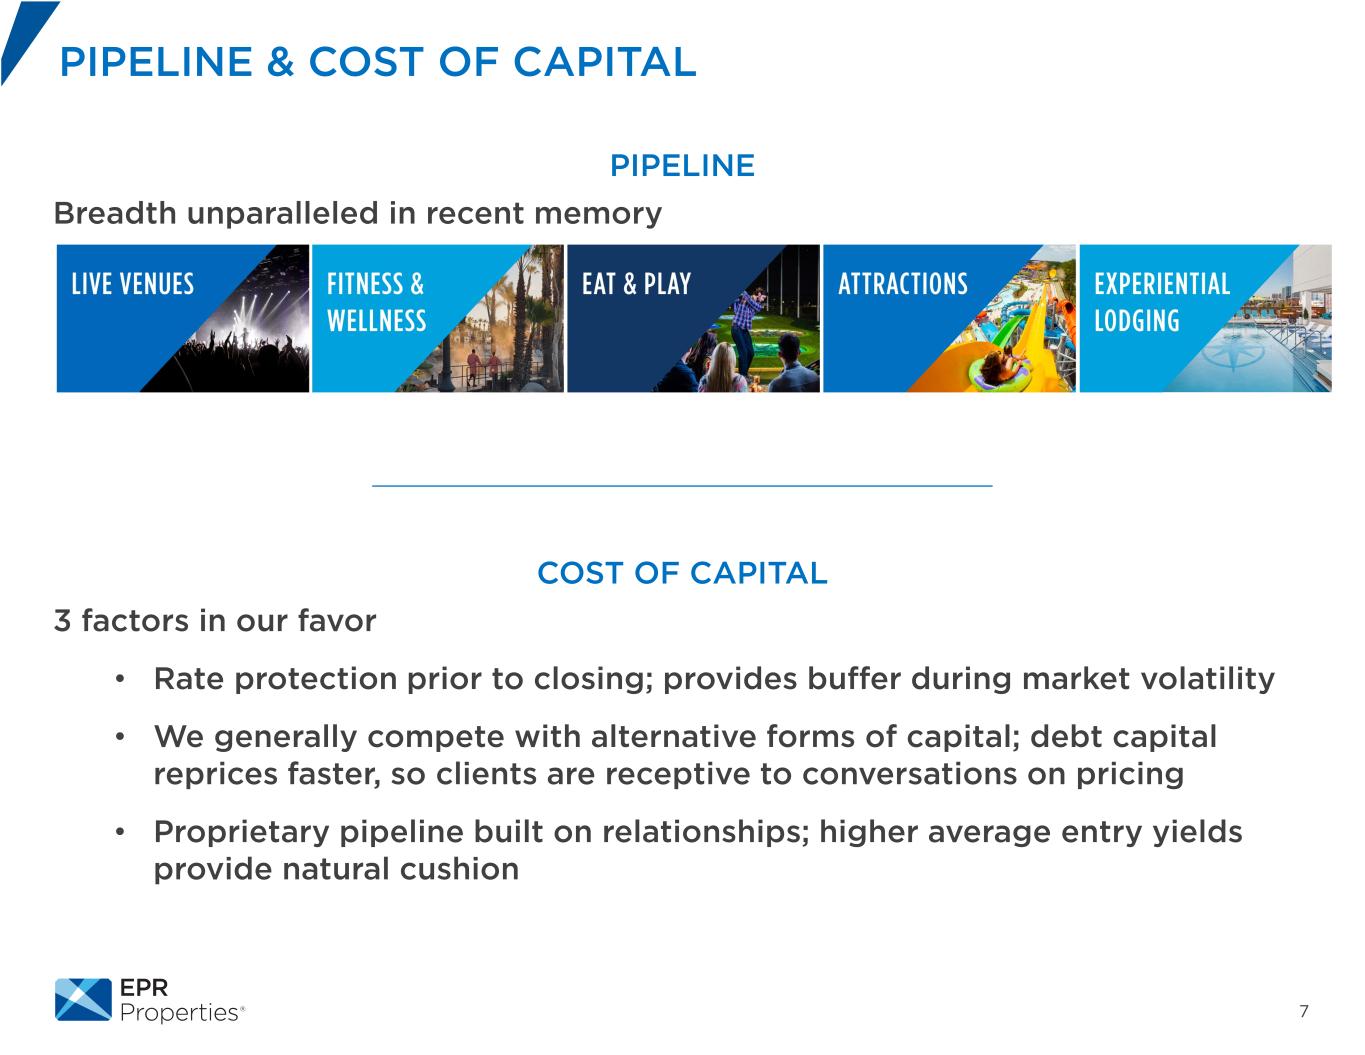
7 PIPELINE Breadth unparalleled in recent memory COST OF CAPITAL 3 factors in our favor • Rate protection prior to closing; provides buffer during market volatility • We generally compete with alternative forms of capital; debt capital reprices faster, so clients are receptive to conversations on pricing • Proprietary pipeline built on relationships; higher average entry yields provide natural cushion PIPELINE & COST OF CAPITAL
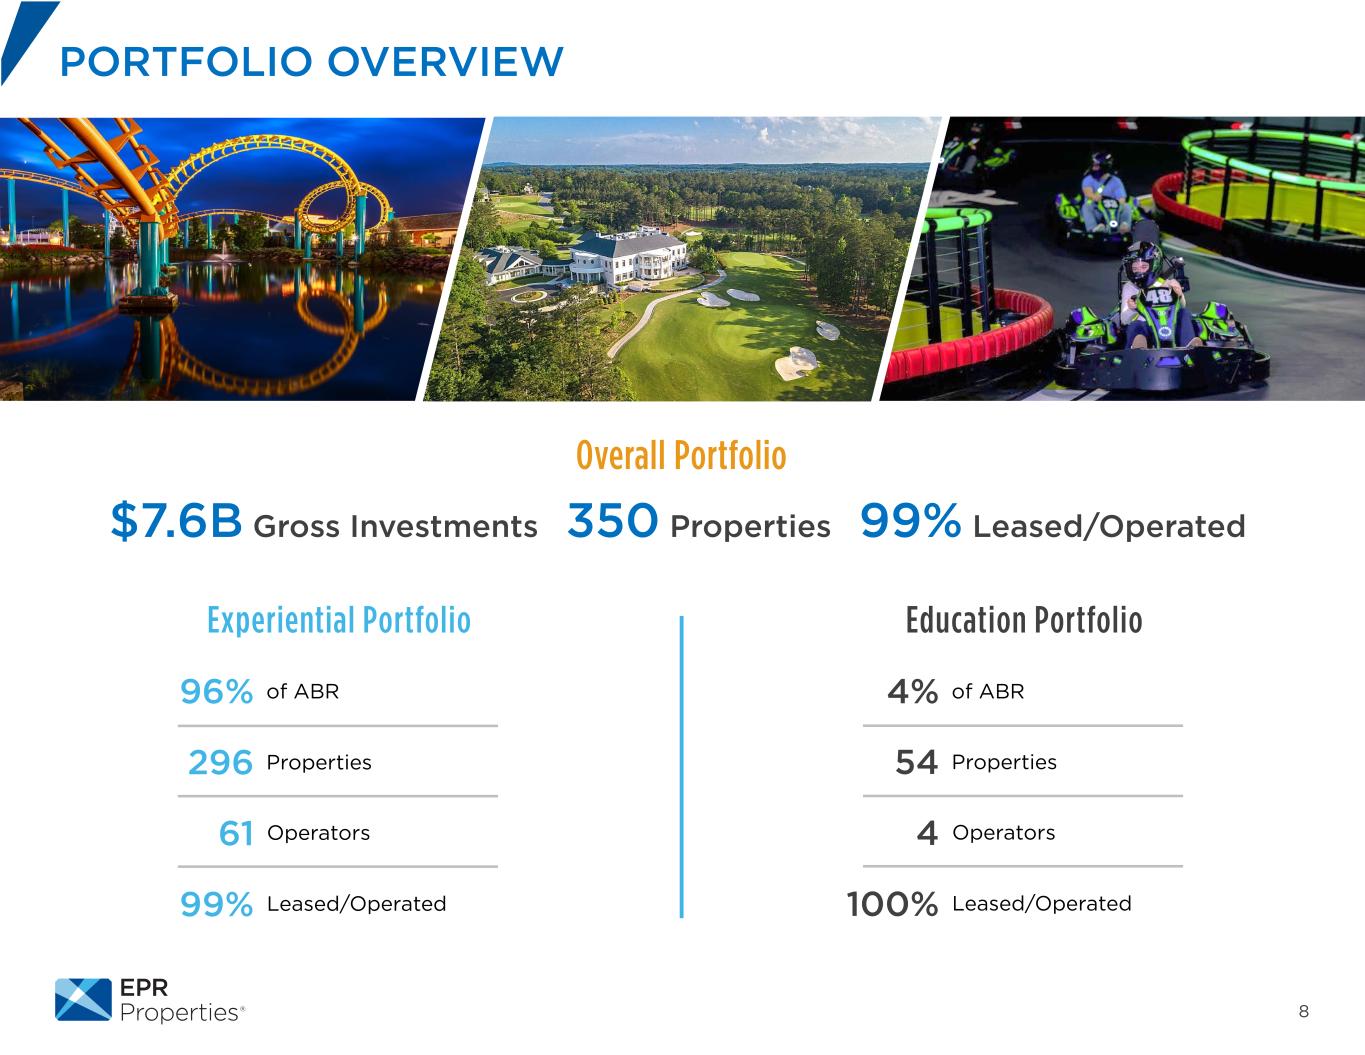
8 PORTFOLIO OVERVIEW Experiential Portfolio Education Portfolio Overall Portfolio $7.6B Gross Investments 350 Properties 99% Leased/Operated 96% of ABR 296 Properties 61 Operators 99% Leased/Operated 4% of ABR 54 Properties 4 Operators 100% Leased/Operated
9*BoxOfficeMojo PORTFOLIO UPDATE Portfolio Coverage of 2.1x Demonstrates Enduring Preference for Experiences Over Things Our Portfolio: diversified experiences appealing to many generations & incomes Theatres: content drives performance; box office up ~20% YTD* • Gen Z are 40% of moviegoers and Gen Alpha prefers the big screen • Our theatres 71% with recliners; 84% with enhanced F&B; 69% with premium screens 3% of North American theatres; generate roughly 8% of NABOG Live Venues: young people lining up for concerts & comedy shows; will partner with leading companies at forefront of trends such as Live Nation Eat & Play: solid performance, strengthened by the quality of our locations, despite broader industry moderation Attractions: delivered strong performance in Q3 Fitness & Wellness: performed well in Q3; stabilizing trends Education: remains resilient despite industry-wide headwinds Dispositions: sold British School of Chicago at cap rate in low 7% range • Updated disposition guidance to $86M
FINANCIAL REVIEW
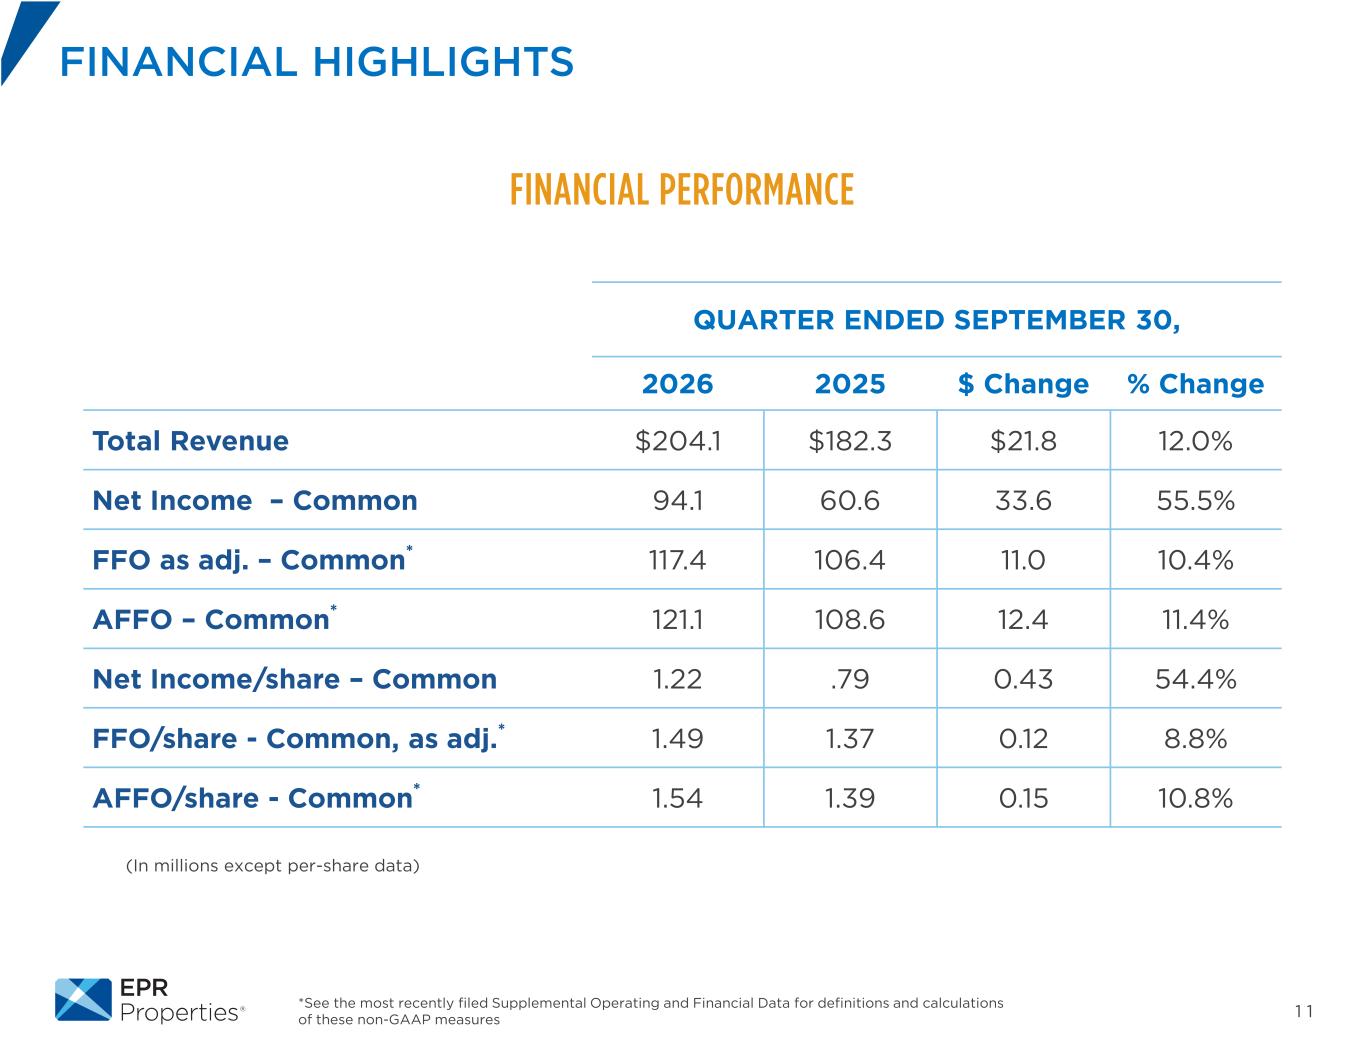
1 1*See the most recently filed Supplemental Operating and Financial Data for definitions and calculations of these non-GAAP measures FINANCIAL HIGHLIGHTS FINANCIAL PERFORMANCE QUARTER ENDED SEPTEMBER 30, 2026 2025 $ Change % Change Total Revenue $204.1 $182.3 $21.8 12.0% Net Income – Common 94.1 60.6 33.6 55.5% FFO as adj. – Common* 117.4 106.4 11.0 10.4% AFFO – Common* 121.1 108.6 12.4 11.4% Net Income/share – Common 1.22 .79 0.43 54.4% FFO/share - Common, as adj.* 1.49 1.37 0.12 8.8% AFFO/share - Common* 1.54 1.39 0.15 10.8% (In millions except per-share data)
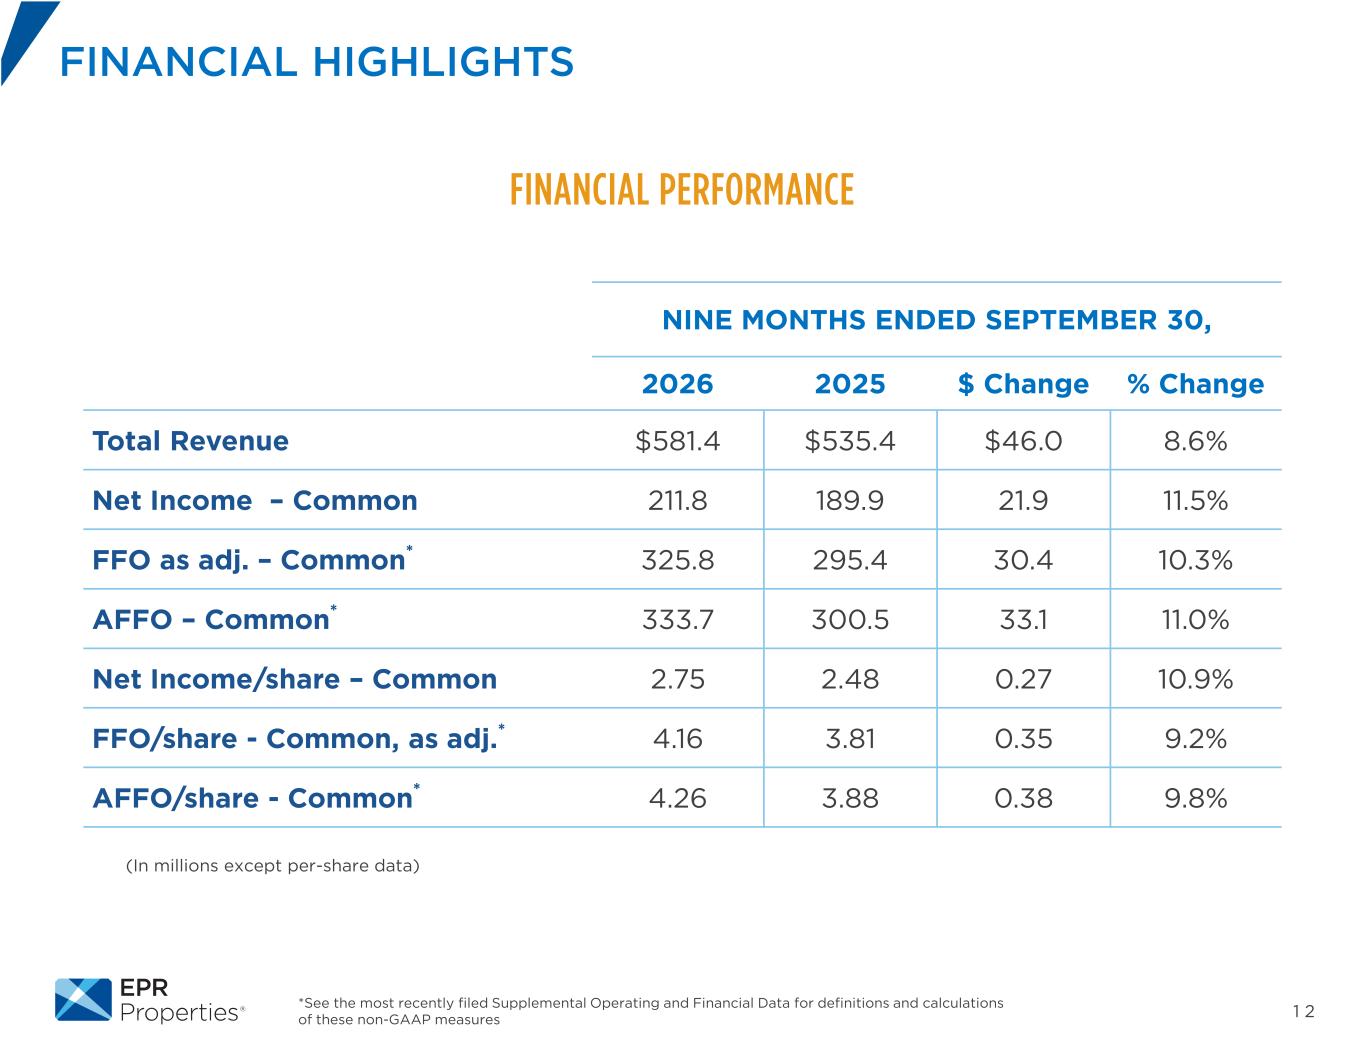
1 2*See the most recently filed Supplemental Operating and Financial Data for definitions and calculations of these non-GAAP measures FINANCIAL HIGHLIGHTS FINANCIAL PERFORMANCE NINE MONTHS ENDED SEPTEMBER 30, 2026 2025 $ Change % Change Total Revenue $581.4 $535.4 $46.0 8.6% Net Income – Common 211.8 189.9 21.9 11.5% FFO as adj. – Common* 325.8 295.4 30.4 10.3% AFFO – Common* 333.7 300.5 33.1 11.0% Net Income/share – Common 2.75 2.48 0.27 10.9% FFO/share - Common, as adj.* 4.16 3.81 0.35 9.2% AFFO/share - Common* 4.26 3.88 0.38 9.8% (In millions except per-share data)
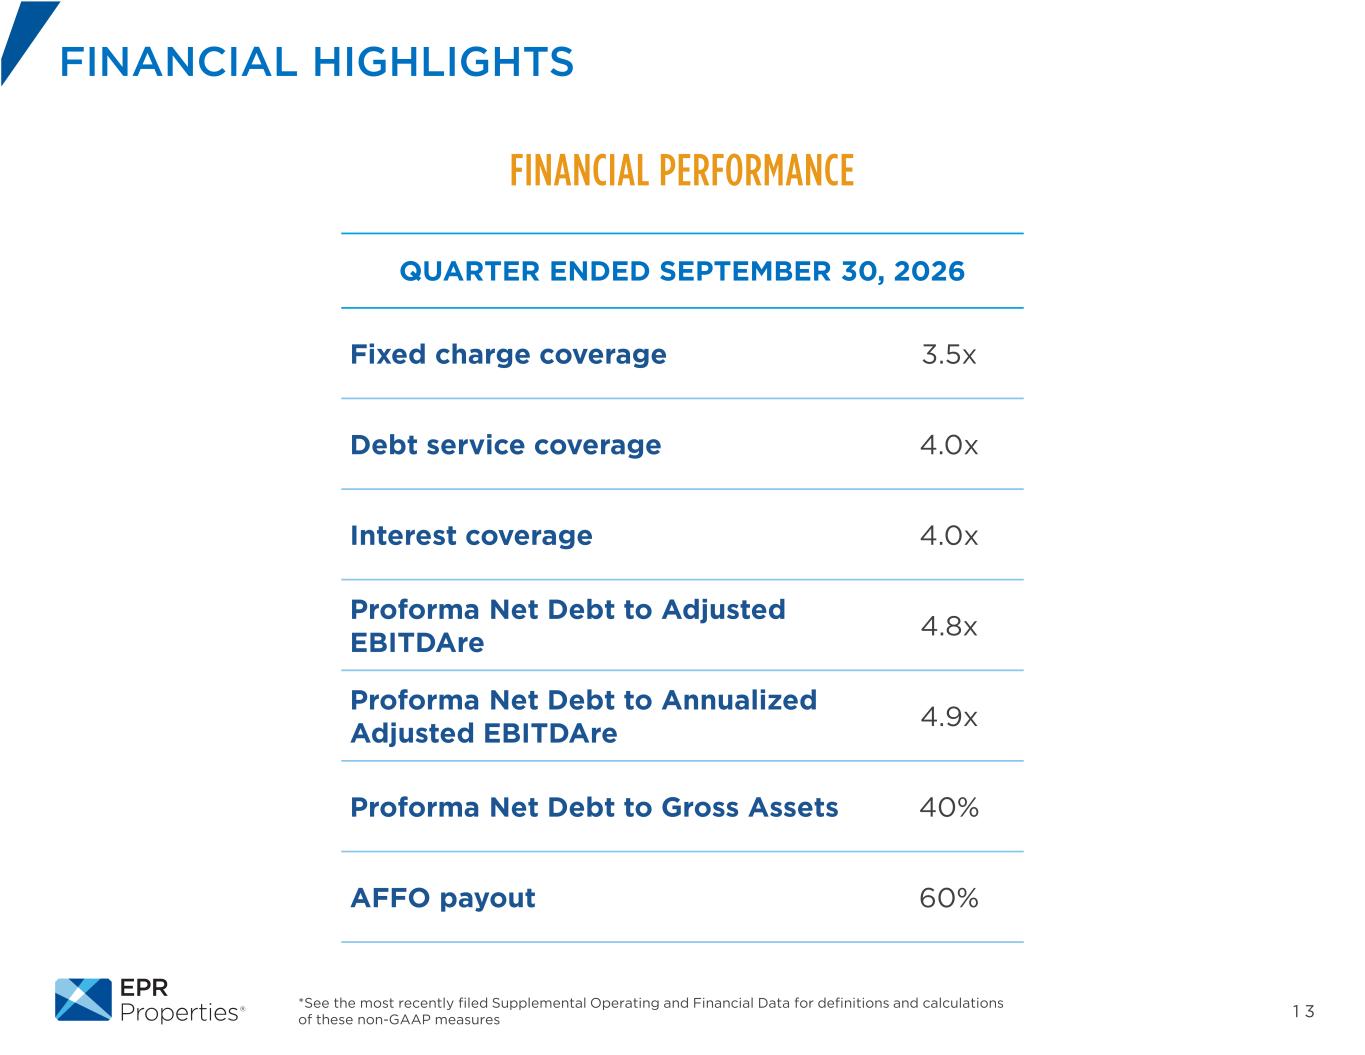
1 3*See the most recently filed Supplemental Operating and Financial Data for definitions and calculations of these non-GAAP measures FINANCIAL HIGHLIGHTS FINANCIAL PERFORMANCE QUARTER ENDED SEPTEMBER 30, 2026 Fixed charge coverage 3.5x Debt service coverage 4.0x Interest coverage 4.0x Proforma Net Debt to Adjusted EBITDAre 4.8x Proforma Net Debt to Annualized Adjusted EBITDAre 4.9x Proforma Net Debt to Gross Assets 40% AFFO payout 60%
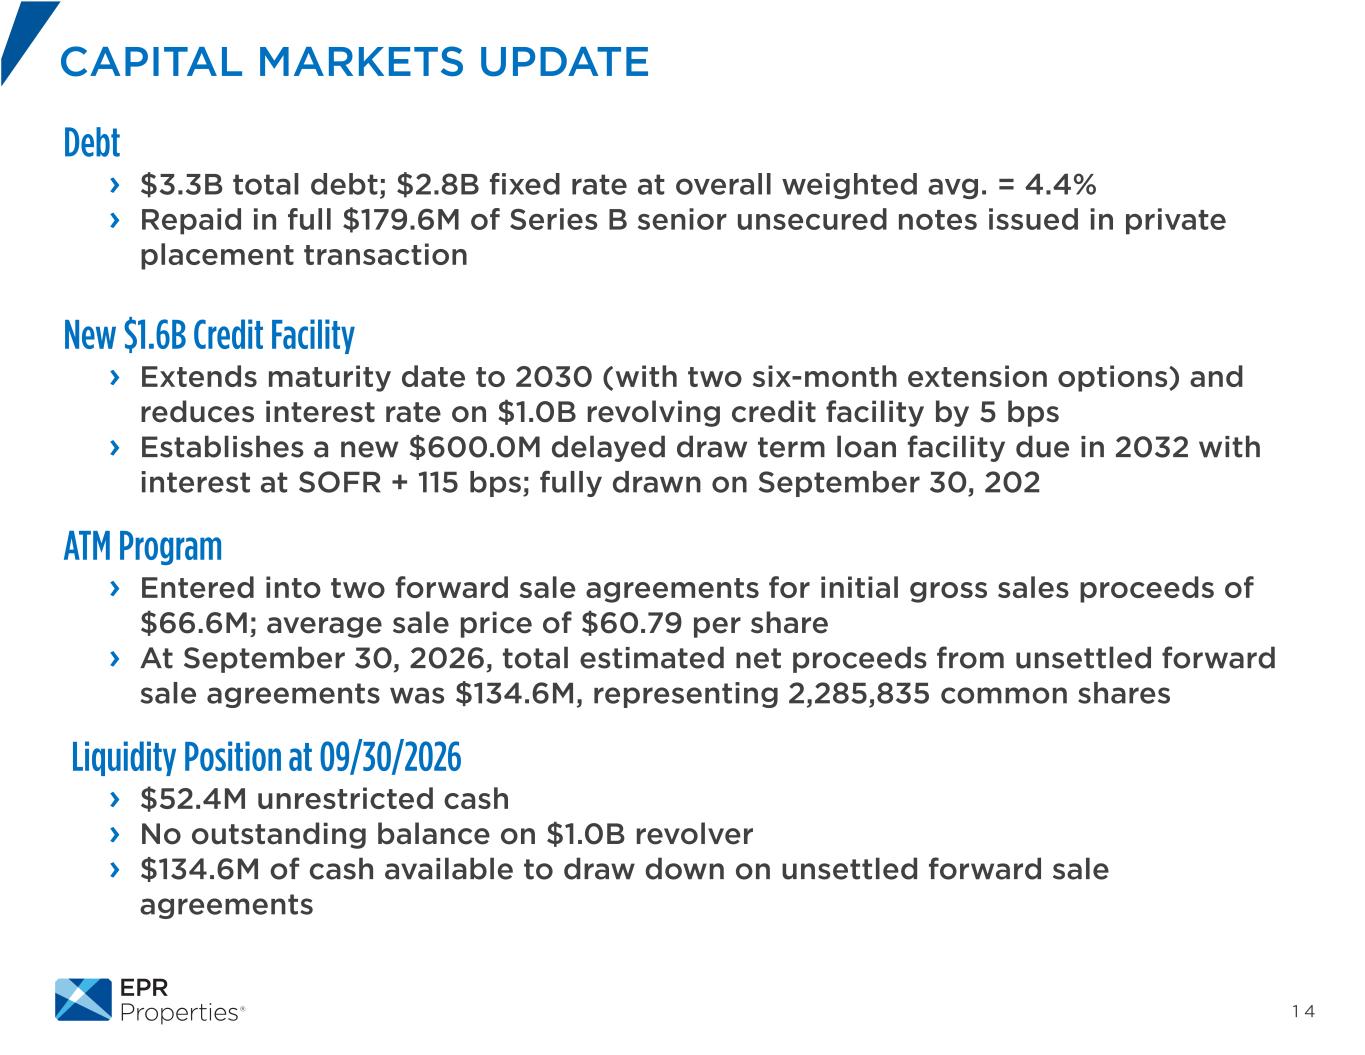
1 4 Debt › $3.3B total debt; $2.8B fixed rate at overall weighted avg. = 4.4% › Repaid in full $179.6M of Series B senior unsecured notes issued in private placement transaction New $1.6B Credit Facility › Extends maturity date to 2030 (with two six-month extension options) and reduces interest rate on $1.0B revolving credit facility by 5 bps › Establishes a new $600.0M delayed draw term loan facility due in 2032 with interest at SOFR + 115 bps; fully drawn on September 30, 202 ATM Program › Entered into two forward sale agreements for initial gross sales proceeds of $66.6M; average sale price of $60.79 per share › At September 30, 2026, total estimated net proceeds from unsettled forward sale agreements was $134.6M, representing 2,285,835 common shares Liquidity Position at 09/30/2026 › $52.4M unrestricted cash › No outstanding balance on $1.0B revolver › $134.6M of cash available to draw down on unsettled forward sale agreements CAPITAL MARKETS UPDATE
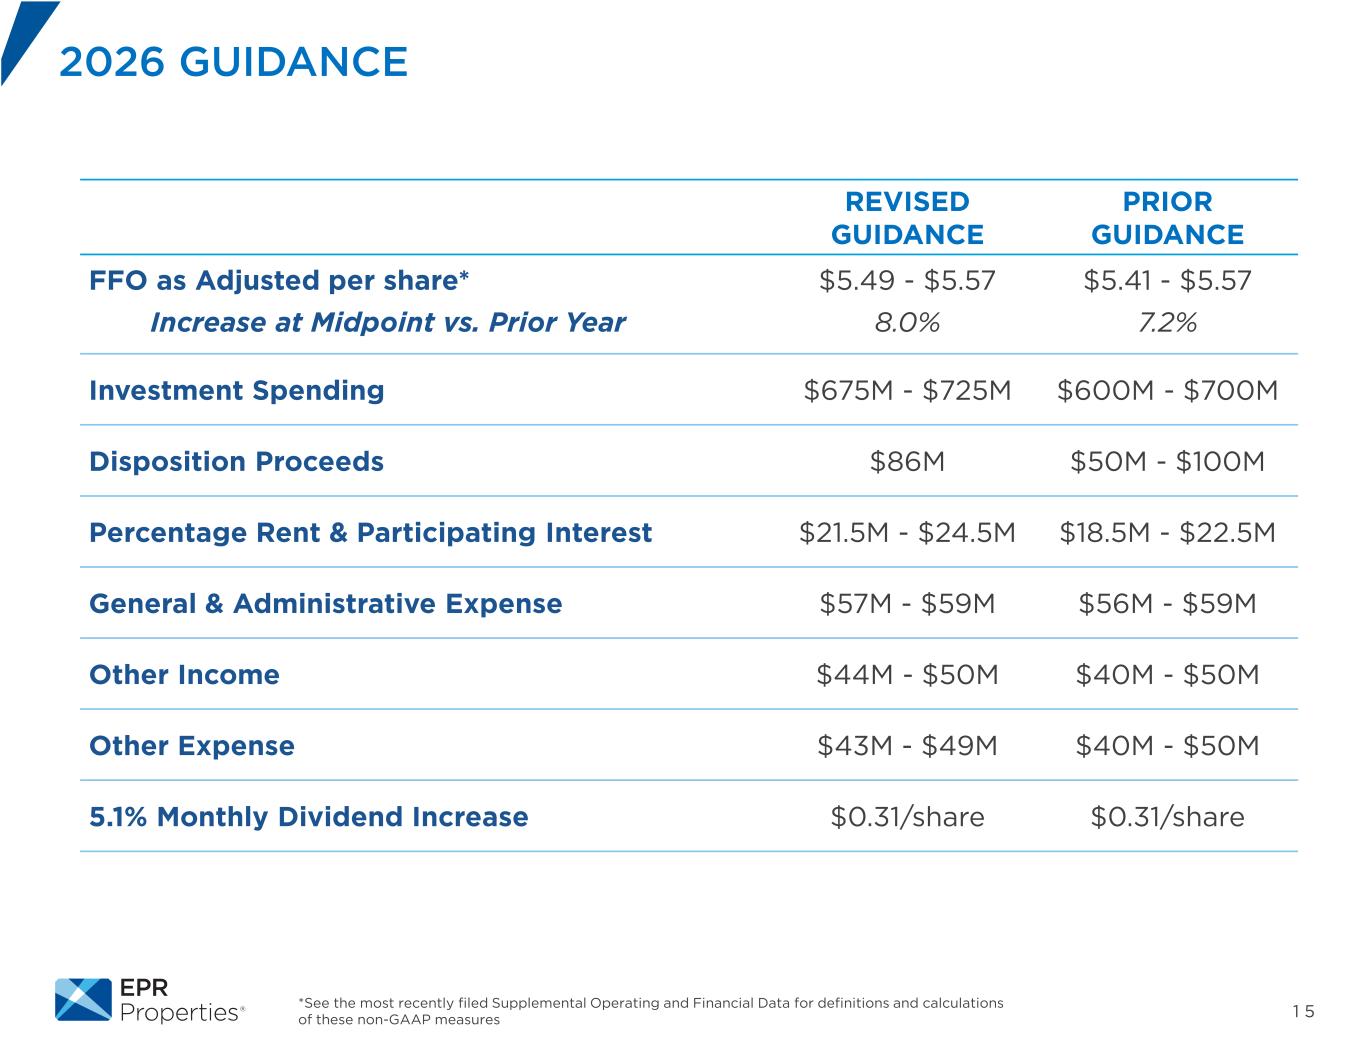
1 5*See the most recently filed Supplemental Operating and Financial Data for definitions and calculations of these non-GAAP measures 2026 GUIDANCE REVISED GUIDANCE PRIOR GUIDANCE FFO as Adjusted per share* $5.49 - $5.57 $5.41 - $5.57 Increase at Midpoint vs. Prior Year 8.0% 7.2% Investment Spending $675M - $725M $600M - $700M Disposition Proceeds $86M $50M - $100M Percentage Rent & Participating Interest $21.5M - $24.5M $18.5M - $22.5M General & Administrative Expense $57M - $59M $56M - $59M Other Income $44M - $50M $40M - $50M Other Expense $43M - $49M $40M - $50M 5.1% Monthly Dividend Increase $0.31/share $0.31/share

CLOSING COMMENTS

QUESTIONS